ShodhKosh: Journal of Visual and Performing ArtsISSN (Online): 2582-7472
|
|
CONSTRUCTION CLIENT SATISFACTION MODEL: VALIDATION IN INDIAN CONTEXT
Dinesh V.C. 1![]()
![]() ,
Dr. P. Easwaran 2
,
Dr. P. Easwaran 2![]()
1 Ph.D.
Research Scholar (Management), Karpagam Academy of Higher Education, Coimbatore,
Tamil Nadu, India
2 Professor,
Department of Commerce, Karpagam Academy of Higher Education, Coimbatore, Tamil
Nadu, India
|
|
|
ABSTRACT |
|
|
Real Estate is
one of the major sectors, responsible for growth of economy in India. It
generates employment, mobilizes resources etc. The author has used Partial
Least Squares Structural Equation Modelling (PLS-SEM) to evaluate and
forecast client satisfaction in the Indian construction sector. Using a
sample of 236 individuals, the study focuses on the characteristics of behavioural intents, tangibles, empathy, responsiveness,
assurance, and dependability. Based on demographic data, the profile of
respondents is diversified, encompassing a wide range of age groups,
educational backgrounds, occupations, and work experience levels. The
examination of the measurement model reveals strong internal consistency and
reliability for every concept, verifying the appropriateness of the chosen
measurement tools. Every construct is validated as unique by the discriminant
validity analysis. Turning now to the structural model, the R Square value of
0.602 indicates that the predictors account for 60.2% of the variability in
Construction Client Satisfaction (CCS). A considerable contribution to the
explanation of CCS variation is made by the model that includes Behavioural Intentions, Responsiveness, Assurance,
Tangibles, Empathy, and Reliability (F = 57.886, p < 0.001). When
individual predictors are looked at, responsiveness and behavioural
intentions stand out as important positive factors that increase client
happiness. Additionally, tangibles are very important since they highlight
how important tangible elements are in determining contentment. But in this
model, there are no statistically significant correlations between CCS and
Assurance, Empathy, or Reliability. Through insights for practitioners and
scholars alike, this study advances our understanding of the dynamics of
client satisfaction in the construction industry. Our comprehension of the
non-significant variables' complex roles in determining customer satisfaction
may be improved by conducting further research on them. |
|||
|
Received 28 January 2026 Accepted 23 March
2026 Published 18 April 2026 Corresponding Author Dinesh
V.C, dineshvcnair@gmail.com DOI 10.29121/shodhkosh.v7.i5s.2026.7697 Funding: This research
received no specific grant from any funding agency in the public, commercial,
or not-for-profit sectors. Copyright: © 2026 The
Author(s). This work is licensed under a Creative Commons
Attribution 4.0 International License. With the
license CC-BY, authors retain the copyright, allowing anyone to download,
reuse, re-print, modify, distribute, and/or copy their contribution. The work
must be properly attributed to its author.
|
|||
|
Keywords: Client Satisfaction, Partial Least Squares
Structural Equation Modeling (PLS-SEM), Behavioral Intentions, Responsiveness
and Tangibles |
|||


1. INTRODUCTION
Individuals believe the peculiarities of satisfaction to be a huge feature of presence. Inside the construction industry, the view of a task's prosperity is vigorously impacted by fulfillment, especially that of the client Durdyev et al. (2018). The capacity to perceive and satisfy client needs is vital for the endurance and seriousness of the worldwide construction area. The possibility of globalization has given the significance of satisfaction as a topic more energy. Fundamentally, specialist organizations' occupation relies upon their capacity to fulfill their clients (for example workers for hire and experts). Consumer loyalty has for quite some time been a difficult situation for the construction industry, and as a business concern, it hasn't gotten a lot of consideration as yet et al. (2019). Clients in the construction industry much of the time express disappointment, which can originate from different factors however is fundamentally brought about by project cost overwhelms, defers in fulfillment, shoddy quality, and bumbling specialist co-ops, like advisors and worker for hire. As per research, getting new construction clients is multiple times more costly than holding flow ones Duljevic and Poturak (2017). In this way, guaranteeing client joy is essential for construction industry players, who should continuously search for ways of performing better if they have any desire to flourish in the worldwide economy.
Various models are accessible for use in analyzing the fulfillment levels of various members in the structure production network Rahman and Alzubi (2015). By and by, a predetermined number of them have been demonstrated to be extremely pertinent for assessing the satisfaction of construction clients. Scarcely any distributions have tended to the use of formal models of administration quality, and client fulfillment in the construction industry keeps on being a troublesome issue. Earlier investigations Nguyen (2019) have for the most part focused on the obtainment course and have shown an association between the client's essential choices and client fulfillment as well as undertaking a positive outcome. It is found that throughout building projects, vital choices take on a few structures. Unsettled questions incorporate what key decisions clients should make at each step of the task and whether client fulfillment levels are impacted by the undertaking's stage. It has been shown that a client's essential options, for example, the definition of an obtainment plan and the early reception of an entire life cost approach, fundamentally influence the result of the venture and the joy of the client. Yet, by definition, the connection between essential decisions and client joy is muddled, and the subject of client delight is as yet certain Cheng et al. (2006).
1.1. Satisfaction Assessment Models
It has been noted that a few evaluation models may be used to identify the criteria for measuring satisfaction Onubi and Hassan (2020). Few of them, nevertheless, are especially relevant to evaluating client satisfaction in the construction industry.
1.1.1. Disconfirmation Model
A made Disconfirmation Model represents how the exhibition of the thing or administration and the client's level of expectation collaborate to impact consumer loyalty. Thus, the error among execution and assumptions decides fulfillment. Many methodologies are accessible for evaluating seen administration quality, for example, the SERVQUAL approach. This approach incorporates numerous factors of seen administration quality, for example, unmistakable, reliability, responsiveness, affirmation, and compassion Ogbu and Imafidon (2022). The discrepancy between customers' expectations and their perceptions of performance is related to perceived service quality Egemen (2022). The services rendered to the client ultimately result in differing levels of pleasure for the recipient. Unfulfilled expectations mostly determine how satisfied a consumer is with a certain service. Customer satisfaction will rise when they believe the performance to be higher than what they had anticipated. Customer satisfaction will decline if the perceived performance falls short of their expectations. But rather than emphasising the good parts of expectations, the Disconfirmation Model concentrated on their negative aspects. In fact, it implied that individuals in charge of controlling client expectations need to make an effort to reduce them Aluko et al. (2021). When a service provider handles consumer expectations in this manner, performance levels may also be unintentionally decreased. This would ultimately lead to decreased levels of client satisfaction. According to Spreng and Mackey (1996), the core of the marketing philosophy is meeting the needs and desires of the client. Nevertheless, the Disconfirmation Model does not use this basic principle as a factor of satisfaction or give it enough consideration Alshihre (2018). The Disconfirmation Model may not be fitting for the assessment of a help, for example, construction administrations given by project workers/experts to a construction client, in light of the fact that the fulfillment processes for labor and products might contrast.
1.1.2. Multi-level model
Dosumu and Aigbavboa (2019) utilized various contextual analyses, a survey of clients and specialists, and experimental examination to make a complex model that deliberate client satisfaction with recruiting an external expert to help with picking a PC based data framework. Six pivotal parts of accomplishment were viewed as by the enlightening model. Aspects included three goal measures — acknowledgment of advisors' suggestions, improvement of clients' perception and specialists' presentation — as well as three abstract measures — the client's level of satisfaction — that were appropriate to every one of the three regions. It was resolved that the complex model would work best when applied to the client-project supervisor communication in construction Maloney (2002). It was laid out that the abstract perspectives were generally unequivocally connected with and affected the feeling of by and large satisfaction, though the goal aspects were less emphatically connected with and affected satisfaction. In any case, the actual model didn't take a gander at how the evaluation cycle could raise client satisfaction Olatokun (2017).
1.2. Research Objectives
· To assess the suitability and efficacy of the suggested model within the Indian context, with a particular emphasis on reliability, responsiveness, assurance, empathy, tangibles, and behavioural intentions.
· To assess the degree of client satisfaction within the construction industry, an analysis of the Construction Client Satisfaction Model's fundamental components is required.
· To examine the impact of dependable service delivery, commitment to commitments, and consistent completion of work orders on client satisfaction in the construction sector.
1.3. Research Hypothesis
H1: A higher level of Reliability positively influences the satisfaction of clients in the construction industry.
H2: Greater Responsiveness positively contributes to the satisfaction of clients in the construction sector.
H3: The presence of Assurance positively influences the satisfaction of clients in the construction industry.
H4: The demonstration of Empathy positively impacts the satisfaction of clients in the construction sector.
H5: Improved Tangibles positively contribute to the satisfaction of clients in the construction industry.
H6: Increased Customer Satisfaction is positively associated with higher levels of behavioral intention in the construction sector.
2. LITERATURE REVIEW
Ingle et al. (2023) addressed the need for an effective project management (PM) system in the construction industry. Focusing on creating a comprehensive PM model, the Modified Project Quarter Back Rating (MPQR), the study explores various performance areas within the construction sector through extensive inventory and semi-structured interviews with industry professionals. The MPQR model aims to provide a holistic evaluation of project success, considering both financial and non-financial aspects of performance assessment. This research contributes to addressing the industry's challenges by offering a more nuanced and encompassing approach to PM in construction projects.
Kumar et al. (2023) directed an extensive report planning to recognize factors impacting the outcome of public structure projects in Ethiopia and survey their effect. Utilizing a poll overview, the review inspected determinants, for example, project supervisor's skill, proprietor's capability, the executives backing and updates, scope clearness (SC), compelling collaborating, and observing and criticism. The outcomes, in light of 200 finished overviews, showed that SC assumed a conclusive part in project achievement, followed intently by successful organization and proprietor's skill. The researched factors by and large showed a huge positive effect on the progress of public construction projects, with a way coefficient of 0.82. The review's underlying condition model (SEM) was considered significant in addressing the connection between these elements and venture achievement. The discoveries, while possibly one-sided because of information restrictiveness, give significant experiences to project directors, underlining the jobs of different develops openly assembling projects. The review's utilization of SEM contributes essentially to hypothetical compositions in construction the executives and conveys suggestions for the Ethiopian government's endeavors to upgrade the productivity of public financing for construction projects.
Ingle and Mahesh (2022a) concentrated on fixates on knowing execution classifications affecting undertaking progress in the Indian construction area. Directing a broad writing survey, the review distinguishes ten execution classifications, including correspondence, participation, climate, partner satisfaction, wellbeing, plan, cost, quality, and efficiency. A review instrument assembles bits of knowledge from industry specialists, and head part investigation (PCA) and primary condition demonstrating (SEM) are utilized for information examination. The review's result approves the significance of these exhibition classifications and furnishes construction the board experts in India with an organized system for upgrading project execution.
Ingle and Mahesh (2022b) studied on the creators utilize halfway least squares primary condition displaying (PLS-SEM) to examine the huge effect of bad quality structure projects on client satisfaction. The reasonable model comprises of two vital idle factors, and a poll review was directed with 484 construction experts in Pakistan's public construction area. The review reasons that unfortunate undertaking quality, as demonstrated by a model worth of 0.454, essentially impacts client satisfaction. Eminently, the component related with construction significantly affects client satisfaction, featuring the basic job of venture quality in forming clients' discernments. The decency of fit file, determined at 0.54, confirms the applied model's legitimacy, unwavering quality, and arrangement with the accumulated information. The review contributes novel experiences and improves how we might interpret the connection between project quality and client satisfaction, using the high level factual methodology of PLS-SEM, a strategy not recently investigated in the writing. Policymakers and leaders are urged to use the review's discoveries to address key worries and difficulties in the worldwide public construction area.
Sinesilassie et al. (2019) analyzed the Venture Quarterback Rating (PQR) model. Taking into account the unverified pertinence of the PQR model in the Indian setting, the creators utilize a study instrument to accumulate data on execution regions. Using a multivariate information examination approach and the Delphi strategy for deciding loads, a changed rendition of the PQR model (MPQR) is built for the Indian setting. The review recognizes three extra critical execution regions — efficiency, partner satisfaction, and climate — for assessing project execution in India. Moreover, the examination lays out the relationship between these presentation regions and undertaking execution. The proposed MPQR model offers significant direction for partners in upgrading the exhibition of construction projects in India, giving a custom-made and far reaching system for evaluation and improvement.
M. D. and Mahesh (2019) improved the safety culture in the Indian construction industry by developing and validating a survey that measures knowledge-based safety culture. The poll obtained 210 valid replies from important individuals in the Indian construction industry, based on a literature review of 69 pertinent factors. The evaluation of the survey's reliability and validity, which involved factor analysis and inter-item correlation tests, confirmed its legitimacy, sensitivity, and reliability. The survey serves as a good instrument for assessing the importance of knowledge management in influencing safety culture within construction firms. The study provides practical insights that might assist construction enterprises in improving safety conditions and adds to the development of safety theory in the Indian construction sector.
Durdyev et al. (2018) explored the connection between service quality (SQ) components and conduct aims of construction clients in Cambodia. Using a hypothetical primary model, the review distinguishes five basic SQ parts: confirmation, sympathy, responsiveness, substantial perspectives, and dependability. Through a poll review including 227 members participated in little to medium-sized projects, the review utilizes fractional least squares primary condition displaying (PLS-SEM) to examine 22 qualities changed by the underlying model. The discoveries highlight the meaning of client satisfaction with predominant service and the requirement for customized co-operations with clients to impact future social aims decidedly.
3. RESEARCH METHODOLOGY
The research design served as a blueprint for the study, providing a structured framework for data collection, analysis, and interpretation. In this study, a quantitative research design was chosen to systematically gather and analyze data related to client satisfaction in the construction sector. Quantitative research was characterized by the collection of numerical data that could be subjected to statistical analysis. This design was deemed appropriate as it allowed for the measurement and quantification of various factors influencing client satisfaction, providing a clear and objective understanding of the research phenomenon.
3.1. Sampling
The sample population for this study comprised individuals with direct experience in the Indian construction industry. This included professionals, clients, and stakeholders who had engaged with construction projects, providing valuable insights into the factors influencing client satisfaction. The study selected 237 participants from the larger population under consideration using a purposive sampling technique. A purposive sampling technique was employed in this study. This approach facilitated the deliberate recruitment of participants who exhibited particular traits or had experiences that were pertinent to the research topic. By purposefully choosing individuals with direct involvement in the construction industry, the study aimed to gather in-depth and contextually rich data. Purposive sampling enhanced the likelihood of including participants who could provide valuable insights into the dimensions of client satisfaction within the construction sector.
3.2. Variables of the study
·
Reliability (RLB):
Reliability in the context of this study referred to the dependability of services provided in the Indian construction industry. This variable encompassed the commitment to delivering what was promised to clients, maintaining a helpful attitude in problem-solving, ensuring work orders were performed as required, adhering to promised timelines for service provision, and providing transparent and continuous reports on work progress. Each aspect contributed to the overall reliability perceived by clients in the construction process.
·
Responsiveness (RES):
Responsiveness pertained to the timeliness and willingness of construction entities to address client needs and concerns. It involved keeping clients informed about when services would be performed, offering immediate service when required, and demonstrating a proactive and helpful attitude in addressing client inquiries. This variable captured the dynamic and timely interactions between construction providers and their clients.
·
Assurance (ASU):
Assurance, as a variable in this study, reflected the confidence and trust instilled in clients by construction service providers. It involved the ability to find solutions when clients encountered challenges, the assurance that the quality of work met established standards, consistent displays of courtesy, and the competence to answer client questions. Assurance encompassed the psychological and tangible aspects that contributed to clients' confidence in the construction services they received.
·
Empathy (EMP):
Empathy in the construction context denoted the understanding and consideration of client-specific needs. This variable includes offering personalized attention to clients, providing post-project maintenance services, and ensuring that business hours aligned with clients' convenience. Empathy recognizes the importance of a client-centric approach and the ability to cater individual preferences and requirements.
·
Tangibles (TNG):
Tangibles referred to the physical and visible elements associated with construction services. This variable includes the availability of the latest tools and equipment in good condition, ensuring a sufficient workforce for project completion, and maintaining proper storing facilities with good housekeeping practices. Tangibles contributed to the tangible aspects of client satisfaction, emphasizing the material resources and conditions associated with construction projects.
·
Construction Client Satisfaction (CCS):
The dependent variable in this study was Construction Client happiness, which measured the overall happiness of clients with the construction services they got. The measure was comprehensive and considered the influence of reliability, responsiveness, assurance, empathy, and tangibles on the total satisfaction of clients during the building process. The Construction Client Satisfaction variable represents the combined impact of many aspects that shape clients' views and assessments of the construction services they have utilized.
·
Behavioral
Intentions (BI):
Behavioral Intentions, acting as both independent and dependent variables, assessed the future actions and decisions of clients based on their past construction service experience. The survey encompasses inquiries regarding clients' propensity to endorse the contractor to others, their intention to engage the same contractor in the future, their readiness to wait for the same contractor in the event of unavailability, and their willingness to pay an elevated fee for the services. Behavioral Intentions refer to the expected actions and choices that arise from the amount of satisfaction experienced.
3.3. Data Collection
Primary Data Collection
Primary data was collected directly from individuals involved in the Indian construction industry, including clients, contractors, architects, and other stakeholders. The primary data collection method involved the distribution of structured questionnaires tailored to gather insights into the dimensions of client satisfaction. The questionnaires included Likert-scale questions related to reliability, responsiveness, assurance, empathy, tangibles, behavioral intentions, and overall satisfaction. The questionnaire design ensured the systematic gathering of responses that reflected participants' perceptions and experiences within the construction context. The data collection process prioritized confidentiality and participants' voluntary participation, and informed consent was obtained.
Data Collection Instruments
The main instrument for primary data collection was a structured questionnaire developed based on the identified variables and the Construction Client Satisfaction Model. The questionnaire was pre-tested to ensure clarity, relevance, and the ability to capture meaningful responses. The Likert scale was utilized to quantify participants' opinions and experiences, allowing for a quantitative analysis of the collected data. This questionnaire contains statements related to your satisfaction with construction materials provided by the supplier. Please rank these statements from 'Completely Dissatisfied' to 'Completely Satisfied.' If you are 'Completely Dissatisfied,' mark a tick () under the cell labeled 'Completely Dissatisfied.' If you are 'Completely Satisfied,' mark a tick () under the cell labeled 'Completely Satisfied.' For in-between preferences, mark accordingly as 'Dissatisfied,' 'Neutral,' or 'Satisfied.'
Secondary Data Collection:
Secondary data complemented the primary data and was sourced from existing literature, academic publications, industry reports, and relevant documents. The secondary data provided a contextual background, theoretical foundation, and industry insights that contributed to the understanding of client satisfaction in the Indian construction sector. This information aided in framing the research within the existing body of knowledge and provided a basis for comparison and validation of findings.
3.4. Tools Used for Data Analysis
For essential information, quantitative information investigation strategies were utilized, including expressive insights, relationship examination, and PLS-SEM. PLS-SEM was especially reasonable for complex models and was utilized to approve the Construction Client Satisfaction Model and inspect connections among factors.
3.5. Limitations
· Limited Generalization: The study's findings may not fully apply to other cultural or regional contexts outside the Indian construction industry.
· Cross-Sectional Design: The study offers a snapshot at a specific point in time, lacking insights into how client satisfaction may evolve over the duration of a project or long-term client-provider relationships.
· Focus on Specific Dimensions: The research concentrates on specific dimensions of client satisfaction, leaving room for future exploration of additional factors that may influence satisfaction in construction projects.
4. RESULTS
4.1. Data demographics
The table presents a breakdown of survey responses based on various demographic characteristics, shedding light on the profile of the respondents.
Table 1
|
Table 1 Demographic Distribution of Responses |
|||
|
Frequency |
Percentage |
||
|
Gender |
Male |
166 |
70 |
|
Female |
41 |
30 |
|
|
Age |
Below 30 |
77 |
32.5 |
|
31-45 |
74 |
31.2 |
|
|
46-60 |
51 |
21.5 |
|
|
Above 60 |
35 |
14.8 |
|
|
Education |
Graduate |
109 |
46 |
|
Post Graduate |
74 |
31.2 |
|
|
Others |
54 |
22.8 |
|
|
Profession |
Business |
53 |
22.4 |
|
Private |
72 |
30.4 |
|
|
Self Employed |
112 |
47.3 |
|
|
Work Experience
in years |
1 -5 Years |
48 |
20.3 |
|
6-10 Years |
96 |
40.5 |
|
|
11 -15 Years |
55 |
23.2 |
|
|
Above 15 Years |
38 |
16 |
|
Figure 1
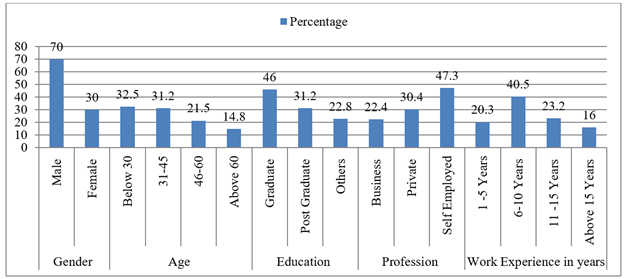
Figure 1
Demographic
Distribution of Responses
Out of 236 participants, 70 respondents classified as male, and 30 respondents as female, making up the majority of the respondents. Participants came from a variety of age ranges. People under 30 made up the biggest category, accounting for 32.5% of the total. Age groups 31–45 and 46–60 accounted for 31.2% and 21.5% of the total, respectively. The percentage of respondents over 60 was 14.8%. Respondents had a range of educational backgrounds; graduates made up the majority (46%) and were followed by post-graduates (31.2%) and others (22.8%). The sample's professional distribution showed that it was broad, with the majority of respondents being self-employed (47.3%), followed by respondents working in the private sector (30.4%) and business professionals (22.4%). The respondents' employment experience varied widely. The biggest category consisted of individuals with 6–10 years of experience (40.5%), then those with 11–15 years (23.2%), 1–5 years (20.3%), and more than 15 years (16%). Although there is a lack of clear consensus on the necessary sample size in the existing literature, the sample size for the SEM approach should be appropriately big. As a result, the response rate for this study met Doloi et al. (2011)'s recommended sample size.
4.2. The Model Assessment
It is critical to take a gander at the connection between the dormant factors and their things prior to doing underlying condition demonstrating. The review's estimation model was assessed further utilizing the accompanying measures: discriminant legitimacy, average variance extracted (AVE), Cronbach's alpha, external loadings, composite dependability, and normal fluctuation removed (Wong 2013).
Table 2
|
Table 2 Evaluation of the measurement model |
||||||
|
Items |
Loadings |
C.Alpha |
Rho_A |
CR |
AVE |
|
|
Reliability 1 |
Fulfillment of services as pledged |
0.79 |
0.816 |
0.963 |
0.845 |
0.712 |
|
Reliability 2 |
Exhibit a cooperative and positive demeanor when addressing and resolving
issues. |
0.81 |
||||
|
Reliability 3 |
The work order was executed according to the specified requirements. |
0.623 |
||||
|
Reliability4 |
Timely delivery of services |
0.692 |
||||
|
Reliability 5 |
Provide regular updates on the status of the task. |
0.762 |
||||
|
Responsiveness 1 |
Providing clients with timely updates on the scheduled time for service
execution |
0.767 |
0.724 |
0.712 |
0.812 |
0.774 |
|
Responsiveness 2 |
Delivering prompt assistance to customers |
0.828 |
||||
|
Responsiveness 3 |
Committed to assisting clients |
0.718 |
||||
|
Assurance 1 |
When faced with difficulties, I am typically able to devise a resolution. |
0.832 |
0.757 |
0.744 |
0.878 |
0.711 |
|
Assurance2 |
I am typically adept at managing any challenges that arise. |
0.753 |
||||
|
Assurance 3 |
Employees that inspire trust in clients. |
0.754 |
||||
|
Assurance 4 |
Ensuring the job meets the required quality standards. |
0.828 |
||||
|
Assurance 5 |
Consistently demonstrating civility |
0.8 |
||||
|
Assurance 6 |
Possessing proficiency in problem-solving |
0.732 |
||||
|
Assurance7 |
Comprehending the unique requirements of individual clients |
0.735 |
||||
|
Empathy1 |
Provide individualized care and attention to clients |
0.728 |
0.734 |
0.619 |
0.711 |
0.812 |
|
Empathy2 |
After-project maintenance service |
0.73 |
||||
|
Empathy3 |
Client-friendly business hours |
0.727 |
||||
|
Empathy4 |
Adequate assortment of state-of-the-art tools and equipment in excellent
condition |
0.764 |
||||
|
Tangibles1 |
Sufficient number of latest tools and equipment in good condition |
0.729 |
0.74 |
0.745 |
0.811 |
0.622 |
|
Tangibles 2 |
Sufficient workforce to complete a project |
0.711 |
||||
|
Tangibles 3 |
Satisfactory storage facilities and effective organization of the
workspace |
0.739 |
||||
|
Tangibles 4 |
Appropriate attire for employees in accordance with the established code
of conduct |
0.75 |
||||
|
Tangibles 5 |
Comprehensive documentation |
0.711 |
||||
|
Construction Client Satisfaction 1 |
I am pleased with the service given by the contractor. |
0.777 |
0.842 |
0.744 |
0.712 |
0.669 |
|
Construction client satisfaction 2 |
I am content with my prudent selection of this contractor. |
0.785 |
||||
|
Construction client satisfaction 3 |
I had a highly satisfactory experience utilizing the services of this
contractor. |
0.78 |
||||
|
Behavioural intention 1 |
Consequently, I intend to endorse and refer this business to others in
the future. |
0.786 |
0.722 |
0.612 |
0.711 |
0.765 |
|
Behavioural intention 2 |
I want to employ the same contractor for future projects. |
0.735 |
||||
|
Behavioural intention 3 |
In the event of unavailability, I will await the same contractor. |
0.643 |
||||
|
Behavioural intention 4 |
I am prepared to provide a higher price in order to hire the contractor. |
0.705 |
||||
The majority of the external loadings exceed the minimum threshold value of 0.70, as seen in Table 2 (Wong 2013). The measures demonstrate high internal consistency reliability, as both their composite and internal (Cronbach's α) reliabilities above the minimum requirement of 0.70 (Wong 2013). All of the constructs had AVE values more than 0.50, which suggests that every item in the measuring model was statistically significant, in line with the guidelines set by Fornell and Larcker (1981). Furthermore, discriminant validity—which measures how much a particular concept varies from other constructs—was evaluated using the Fornell-Larcker criteria (Ihtiyar 2018). The construct of Reliability exhibits strong internal consistency, and all items show adequate loadings between .623 and .810. The suggested criterion of .70 is exceeded by the high composite reliability (C.Alpha) of .816, suggesting that the items accurately assess the underlying concept. The scale's dependability is further supported by the remarkable build reliability (Rho_A), which stands at 0.963. Item loadings inside the Responsiveness construct are strong, ranging from . 718 to .828. While the build reliability (Rho_A) is excellent at 0.712, the composite reliability (C.Alpha) is acceptable at .724. These findings imply that the items assess the desired construct accurately. Assurance items have significant factor loadings between .732 and .832. With strong construct reliability (Rho_A) of 0.744 and a composite reliability (C.Alpha) of .757, both metrics demonstrate excellent internal consistency. The acceptable loadings for empathy goods range from .727 to .764. The build reliability (Rho_A) is .619, while the composite reliability (C.Alpha) is .734. Although the C.Alpha satisfies the suggested criterion, more research on the construct dependability of the Rho_A should be done.
Strong factor loadings for tangibles range from .711 to .750. Robust internal consistency is shown by the composite reliability (C.Alpha) of .740 and the construct reliability (Rho_A) of .745. The Construction Client Satisfaction items have significant factor loadings between .777 and .785. Strong dependability is shown by the high composite reliability (C.Alpha) of .842 and the build reliability (Rho_A) of .744. Items related to behavioural intentions have loadings that are acceptable and range from .643 to .786. The build reliability (Rho_A) is .612 and the composite reliability (C.Alpha) is .722. Although the C.Alpha is okay, more research may be necessary for the Rho_A.
4.3. The structural model
It is plausible to survey the underlying model in additional detail when the estimation model has been agreeably assessed. The essential objective of PLS-SEM is to expand the fluctuation of the reliant factors through forecast. Since the coefficient of assurance (R2) measures how much change and the prescient limit of the important idea, it ought to be the reason for a PLS model assessment's underlying step (Jaw, 2010).
Table 3
|
Table 3 Model Summary |
||||
|
Model Summary |
||||
|
Model |
R |
R Square |
Adjusted R Square |
Std. Error of the Estimate |
|
1 |
.776a |
0.602 |
0.591 |
0.50256 |
|
a. Predictors: (Constant),
BI, RES, ASS, TANG, EMP, REL |
||||
The model rundown gives an outline of the relapse model's presentation in foreseeing Construction Client Satisfaction (CCS). The R Square worth of .602 shows that around 60.2% of the fluctuation in CCS can be made sense of by the blend of the indicators remembered for the model. The Changed R Square, representing the quantity of indicators, remains at .591, proposing a strong fit. The standard blunder of the gauge is 0.50256, addressing the typical distance between the noticed and anticipated values.
Table 4
|
Table 4 ANOVA |
||||||
|
ANOVAa |
|
|||||
|
Model |
|
Sum of Squares |
df |
Mean Square |
F |
Sig. |
|
1 |
Regression |
87.722 |
6 |
14.62 |
57.886 |
.000b |
|
Residual |
58.091 |
230 |
0.253 |
|
|
|
|
Total |
145.812 |
236 |
|
|
|
|
|
a. Dependent Variable: CCS b. Predictors: (Constant), BI, RES, ASS, TANG, EMP, REL |
||||||
The ANOVA table evaluates the global significance of the regression model. The regression model, with predictors Behavioral Intentions (BI), Responsiveness (RES), Assurance (ASS), Tangibles (TANG), Empathy (EMP), and Reliability (REL), significantly contributes to explaining the variance in CCS (F = 57.886, p < .001). The obtained F-statistic of 57.886 is considerably higher than the critical value, indicating the model's overall significance.
Table 5
|
Table 5 Correlation Coefficient |
||||||
|
Coefficientsa |
|
|||||
|
Model |
Unstandardized Coefficients |
Standardized Coefficients |
||||
|
B |
Std. Error |
Beta |
t |
Sig. |
||
|
1 |
(Constant) |
0.305 |
0.241 |
1.263 |
0.208 |
|
|
REL |
-0.069 |
0.078 |
-0.064 |
-0.89 |
0.374 |
|
|
RES |
0.156 |
0.074 |
0.154 |
2.126 |
0.035 |
|
|
ASS |
-0.055 |
0.077 |
-0.038 |
-0.71 |
0.478 |
|
|
EMP |
-0.005 |
0.078 |
-0.005 |
-0.071 |
0.944 |
|
|
TANG |
0.278 |
0.08 |
0.239 |
3.47 |
0.001 |
|
|
BI |
0.64 |
0.079 |
0.553 |
8.063 |
0 |
|
|
a. Dependent Variable: CCS |
|
|
|
|
|
|
The coefficients table offers valuable insights into the individual impact of each predictor on the dependent variable (CCS). The unstandardized coefficients indicate the amount by which the dependent variable changes when the predictor variable increases by one unit. Notably, Behavioral Intentions (BI) has a substantial positive impact (B = 0.640, p < .001), suggesting a significant role in influencing CCS. Responsiveness (RES) also makes a positive and significant contribution (B = 0.156, p = .035), indicating that higher levels of responsiveness are associated with increased client satisfaction. Tangibles (TANG) show a strong positive impact (B = 0.278, p = .001), emphasizing the importance of tangible factors in influencing client satisfaction. Reliability (REL), Assurance (ASS), and Empathy (EMP) do not show statistically significant relationships with CCS in this model.
5. DISCUSSION AND CONCLUSIONS
The demographic breakdown provides a comprehensive understanding of the study participants. The gender distribution indicates a higher representation of males, reflecting the industry's current composition. The diverse age groups and educational backgrounds contribute to a varied perspective on client satisfaction within the construction sector. The significant presence of self-employed individuals aligns with the nature of the construction industry, where entrepreneurship is common. Work experience distribution ensures insights from professionals at different career stages, enriching the study's findings.
Table 6
|
Table 6 Results of Hypothesis |
||
|
Hypothesis |
Findings |
Conclusion |
|
H1 |
0.374 |
Not supported |
|
H2 |
0.035 |
Supported |
|
H3 |
0.478 |
Not supported |
|
H4 |
0.944 |
Not supported |
|
H5 |
0.001 |
Supported |
|
H6 |
0 |
Supported |
This study uses a strong quantitative research methodology to explore the dynamics of customer satisfaction in the Indian construction sector. PLS-SEM is used to analyse data. The assessment of the measuring model indicates that the selected constructs—reliability, assurance, empathy, tangibles, customer satisfaction in the construction industry, and behavioural intentions—show excellent internal consistency, reliability, and validity. The results emphasize the complexity of client happiness and the role that both concrete and intangible elements play in forming clients' opinions and determining their future behaviour intentions. The structural model study highlights how important tangibles, behavioural intents, and responsiveness are to construction clients' pleasure. In order to be satisfied overall, clients value prompt and proactive communication, the tangible components of building services, and satisfying prior experiences. These observations have important ramifications for legislators and construction professionals who want to improve customer satisfaction and cultivate goodwill within the sector.
CONFLICT OF INTERESTS
None.
ACKNOWLEDGMENTS
None.
REFERENCES
Alshihre, F. (2018). Development of a Framework for Client Satisfaction in the Saudi Construction Industry (Doctoral Dissertation, University of Wolverhampton).
Aluko, O. R., Idoro, G. I., and Mewomo, M. C. (2021). Relationship Between Perceived Service Quality and Client Satisfaction Indicators of Engineering Consultancy Services in Building Projects. Journal of Engineering, Design and Technology, 19(2), 557–577. https://doi.org/10.1108/JEDT-03-2020-0084
Cheng, J., Proverbs, D. G., and Oduoza, C. F. (2006). The Satisfaction Levels of UK Construction Clients Based on the Performance of Consultants: Results of a Case Study. Engineering, Construction and Architectural Management, 13(6), 567–583. https://doi.org/10.1108/09699980610712373
Dosumu, O. S., and Aigbavboa, C. (2019). Assessing Clients’ Satisfaction with the Service Quality of Construction Consultants in Lagos, Nigeria. African Journal of Science, Technology, Innovation and Development, 11(6), 771–779. https://doi.org/10.1080/20421338.2019.1585676
Duljevic, M., and Poturak, M. (2017). Study on Client-Satisfaction Factors in Construction Industry. European Journal of Economic Studies, 6(2), 104–114.
Durdyev, S., Ihtiyar, A., Banaitis, A., and Thurnell, D. (2018). The Construction Client Satisfaction Model: A PLS-SEM Approach. Journal of Civil Engineering and Management, 24(1), 31–42. https://doi.org/10.3846/jcem.2018.297
Egemen, M. (2022). Building Construction Clients’ Design Consultant and Contractor Selection Criteria Versus Post-Occupancy Satisfaction Levels. SAGE Open, 12(2), 21582440221089968. https://doi.org/10.1177/21582440221089968
Hussain, S., FangWei, Z., and Ali, Z. (2019). Examining Influence of Construction Projects’ Quality Factors on Client Satisfaction Using Partial Least Squares Structural Equation Modeling. Journal of Construction Engineering and Management, 145(5), 05019006. https://doi.org/10.1061/(ASCE)CO.1943-7862.0001655
Ingle, P. V., Gangadhar, M., and Deepak, M. D. (2023). Developing a Project Performance Assessment Model for Benchmarking the Project Success of Indian Construction Projects. Benchmarking: An International Journal. https://doi.org/10.1108/BIJ-09-2022-0553
Ingle, P. V., and Mahesh, G. (2022a). Construction Project Performance Areas for Indian Construction Projects. International Journal of Construction Management, 22(8), 1443–1454. https://doi.org/10.1080/15623599.2020.1721177
Ingle, P. V., and Mahesh, G. (2022b). Exploring Performance Areas and Developing Performance Assessment Model for Construction Projects in India. Journal of Facilities Management. https://doi.org/10.1108/JFM-05-2022-0050
Kumar, V., Pandey, A., and Singh, R. (2023). Project Success and Critical Success Factors of Construction Projects: Project Practitioners’ Perspectives. Organization, Technology and Management in Construction: An International Journal, 15(1), 1–22. https://doi.org/10.2478/otmcj-2023-0001
M. D., D., and Mahesh, G. (2019). Developing a Knowledge-Based Safety Culture Instrument for the Construction Industry: Reliability and Validity Assessment in Indian Context. Engineering, Construction and Architectural Management, 26(11), 2597–2613. https://doi.org/10.1108/ECAM-09-2018-0383
Maloney, W. F. (2002). Construction Product/Service and Customer Satisfaction. Journal of Construction Engineering and Management, 128(6), 522–529. https://doi.org/10.1061/(ASCE)0733-9364(2002)128:6(522)
Nguyen, L. H. (2019). Relationships Between Critical Factors Related to Team Behaviors and Client Satisfaction in Construction Project Organizations. Journal of Construction Engineering and Management, 145(3), 04019002. https://doi.org/10.1061/(ASCE)CO.1943-7862.0001620
Ogbu, C. P., and Imafidon, M. O. (2022). Influence of Selection Criteria on Clients’ Satisfaction with Construction Consultancy Services in Nigeria. Journal of Engineering, Design and Technology, 20(6), 1519–1537. https://doi.org/10.1108/JEDT-02-2021-0081
Olatokun, E. O. (2017). Requirement Elicitation Using Knowledge Capturing (KC) Techniques During the Client Briefing Process for Improved Client Satisfaction in the UK Construction Industry (Doctoral Dissertation, University of Salford). ProQuest.
Onubi, H. O., and Hassan, A. S. (2020). How Environmental Performance Influences Client Satisfaction on Projects that Adopt Green Construction Practices: The Role of Economic Performance and Client Types. Journal of Cleaner Production, 272, 122763. https://doi.org/10.1016/j.jclepro.2020.122763
Rahman, A., and Alzubi, Y. (2015). Exploring Key Contractor Factors Influencing Client Satisfaction Level in Dealing with Construction Projects: An Empirical Study in Jordan. International Journal of Academic Research in Business and Social Sciences, 5(12), 109–126. https://doi.org/10.6007/IJARBSS/v5-i12/1935
Sinesilassie, E. G., Tripathi, K. K., Tabish, S. Z. S., and Jha, K. N. (2019). Modeling Success Factors for Public Construction Projects With the SEM Approach: Engineers’ Perspective. Engineering, Construction and Architectural Management, 26(10), 2410–2431. https://doi.org/10.1108/ECAM-04-2018-0162
|
|
 This work is licensed under a: Creative Commons Attribution 4.0 International License
© ShodhKosh 2026. All Rights Reserved.