ShodhKosh: Journal of Visual and Performing ArtsISSN (Online): 2582-7472
|
|
Art, Perception, and Decision-Making: An Exploratory Study of Knowledge and investor Behavioral Patterns in the Indian Creative Economy
Anushka Mamania 1![]()
![]() ,
Dr. Jyoti Singhal 2
,
Dr. Jyoti Singhal 2![]()
![]() , Girish
Kirtani 3
, Girish
Kirtani 3![]()
![]() , Dr.
Sonia Gupta 4
, Dr.
Sonia Gupta 4![]()
![]() , Dr.
Neha Sharma 5
, Dr.
Neha Sharma 5![]()
![]()
1 Research
Scholar, Vijay Patil School of Management, D.Y. Patil University (Deemed
University), Navi Mumbai, India
2 Research
Guide, Vijay Patil School of Management, D.Y. Patil University (Deemed
University), Navi Mumbai, India
3 Assistant Professor, Vijay Patil School of Management, D Y Patil
(Deemed University), Navi Mumbai, India
4 Assistant Professor, Bharati Vidyapeeth Institute of Management
Studies and Research, Navi Mumbai, India
5 Assistant Professor, Bharati Vidyapeeth (Deemed to be University),
Department of Management Studies (Off Campus), Navi Mumbai, India
|
|
|
ABSTRACT |
|
|
The Indian capital market has emerged as a vital platform for channelizing savings into productive investments; however, the effectiveness of investor participation largely depends on their level of technical understanding. The present study examines the relationship between investor technical knowledge, technical analysis knowledge, and satisfaction with investment decision-making in the Indian capital market. Using primary data collected from 140 investors through a structured questionnaire, the study analyzes demographic characteristics, investment behavior, and knowledge dimensions to assess their influence on satisfaction. Statistical tools such as Pearson correlation, multiple regression analysis, ANOVA, and Structural Equation Modeling (SEM) were employed to test the formulated hypotheses and evaluate the explanatory power of the model. The findings
reveal that while technical analysis knowledge has a positive but relatively
weak relationship with investor satisfaction, overall technical knowledge
exhibits a strong and statistically significant impact on satisfaction
levels. The regression and SEM results confirm that broader technical
understanding of market mechanisms and investment processes plays a more
dominant role in enhancing investor confidence and perceived decision
quality. The study concludes that improving investor technical knowledge can
significantly enhance satisfaction and lead to more informed and effective
participation in the Indian capital market, highlighting the need for
targeted investor education and awareness programs. |
|||
|
Received 19 January 2026 Accepted 23 March
2026 Published 11 April 2026 Corresponding Author Anushka
Mamania, anushkamamania24@gmail.com
DOI 10.29121/shodhkosh.v7.i4s.2026.7638 Funding: This research
received no specific grant from any funding agency in the public, commercial,
or not-for-profit sectors. Copyright: © 2026 The
Author(s). This work is licensed under a Creative Commons
Attribution 4.0 International License. With the
license CC-BY, authors retain the copyright, allowing anyone to download,
reuse, re-print, modify, distribute, and/or copy their contribution. The work
must be properly attributed to its author.
|
|||
|
Keywords: Indian Capital Market, Investor Technical Knowledge,
Technical Analysis, Investment Satisfaction |
|||


1. INTRODUCTION
The Indian Capital Market plays a crucial role in mobilizing savings and channelizing them into productive investments, thereby contributing significantly to the country’s economic growth. It provides a platform for interaction between investors and issuers of capital, enabling companies to raise long-term funds for expansion and development while offering investors opportunities to earn returns. The capital market in India comprises the primary market, where new securities are issued, and the secondary market, where existing securities are traded, ensuring liquidity and price discovery. Over time, the Indian capital market has evolved from a relatively restricted system to a more transparent, technology- driven, and investor-oriented framework.
In recent decades, the Indian capital market has witnessed substantial modernization with the introduction of electronic trading, online investment platforms, dematerialization of securities, and faster settlement systems. These developments have significantly reduced transaction costs, improved accessibility, and enhanced market efficiency. Regulatory reforms and continuous oversight by market authorities have strengthened investor protection, improved disclosure standards, and promoted fair trading practices. As a result, participation from retail investors, institutional investors, and foreign investors has increased, making the market more dynamic and competitive.
Despite its growth and sophistication, the Indian capital market remains sensitive to factors such as economic conditions, market volatility, global financial trends, and investor awareness levels. Many investors still face challenges related to limited technical knowledge, behavioral biases, and risk perception, which can affect their investment decisions and satisfaction. Therefore, enhancing investor education, financial literacy, and technical understanding is essential for ensuring informed participation and long-term stability of the market. A well-informed investor base not only improves individual decision-making but also contributes to the overall efficiency and resilience of the Indian capital market.
1.1. Investor Technical Knowledge of Indian Capital Market
Investor technical knowledge in the Indian capital market refers to an investor’s understanding of market mechanisms, trading processes, financial instruments, regulatory framework, and analytical tools used for making investment decisions. This includes awareness of concepts such as risk–return trade-off, diversification, market indices, order types, settlement cycles, and the functioning of stock exchanges. Technical knowledge enables investors to interpret market information accurately, evaluate investment opportunities logically, and participate more confidently in the capital market. In an increasingly complex and technology-driven market environment, such knowledge has become essential for effective investment decision-making.
With the expansion of online trading platforms, real-time market data, and advanced analytical tools, the importance of investor technical knowledge has increased significantly. Investors who possess sound technical understanding are better equipped to use digital platforms, analyze price movements, understand market trends, and manage investment risks efficiently. Conversely, limited technical knowledge may lead to overdependence on intermediaries, susceptibility to misinformation, and emotionally driven decisions. Therefore, technical competence not only improves decision quality but also enhances investors’ confidence and satisfaction with their investment outcomes.
In the Indian context, the level of technical knowledge among investors varies widely based on factors such as education, income, occupation, and investment experience. While professionally qualified and experienced investors generally demonstrate higher technical awareness, a large segment of retail investors still lacks adequate understanding of market operations and analytical techniques. This highlights the need for continuous investor education initiatives, training programs, and awareness campaigns by regulatory bodies, financial institutions, and market intermediaries. Strengthening investor technical knowledge is essential for promoting informed participation, improving investment satisfaction, and ensuring the long-term stability and efficiency of the Indian capital market.
2. Review of Literature
1) Prasad (2025), In the research paper titled “A Study of Evaluating Investor Technical Knowledge of Mutual Funds and Satisfaction of Decision Making” The study establishes that investors’ technical understanding (knowledge of product features, risk–return linkage, and basic evaluation methods) is positively associated with how satisfied they feel about their investment decisions. It suggests that when investors perceive themselves as technically informed, they experience higher confidence, lower regret, and stronger perceived decision quality. The work also implies that lack of technical clarity increases dependence on external advice and may reduce satisfaction due to uncertainty and post-decision anxiety.
2) Nag and Prathap (2025), In the research paper titled “Financial Literacy and the Investor Satisfaction: A Behavioral Study Among the Retail Investors in Karnataka” This study finds a positive relationship between financial literacy and investor satisfaction, showing that higher knowledge improves confidence and leads to more informed choices. The results highlight that limited literacy is linked with risk-averse behavior and only moderate satisfaction, partly due to worries about credible financial services and information access. Overall, the paper supports the view that strengthening literacy can improve both decision comfort and perceived financial well-being among retail investors.
3) Singh and Gupta (2021), In the research paper titled “The Impact of Financial Literacy on Investor Attitudes and Decision-Making: An Empirical Analysis” Using factor analysis and SEM, the study concludes that financial literacy significantly influences investment decision-making both directly and indirectly through investor attitude. Investors with stronger literacy tend to develop a more positive, confident attitude toward investing, which supports better decision outcomes. The paper emphasizes practical value for regulators and educators: improving literacy and investor attitude can help reduce avoidable losses and strengthen decision effectiveness in capital market participation.
4) Mishra (2018), In the research paper titled “Financial Literacy, Risk Tolerance and Stock Market Participation” Based on Indian household survey evidence (including SEBI-linked survey data), the study concludes that financial literacy and investment awareness significantly increase the likelihood of stock market participation, alongside risk tolerance. It also shows demographic differences in participation and highlights the usefulness of financial education programs in raising awareness and enabling better investment choices. The results imply that knowledge is a key gateway variable for engaging with the capital market and making more deliberate decisions.
5) Patil and Bagodi (2021), In the research paper titled “A Study of Factors Affecting Investment Decisions in India: The KANO Way” This research identifies what investors consider “must-be,” “performance,” and “delight” attributes when making stock market decisions in India. It finds that fundamentals like financial statements and macro indicators are baseline requirements, while outputs of technical analysis can meaningfully shape decision consideration, and certain informational cues act as “delighters.” The study’s contribution is a structured mapping of investor decision drivers, reinforcing that both analytical knowledge and informational interpretation influence investment decision behavior.
6) Raut (2020), In the research paper titled “Past Behaviour, Financial Literacy and Investment Decision-Making Process of Individual Investors” Using the Theory of Planned Behaviour framework with Indian investors, the study concludes that financial literacy meaningfully shapes investment intention and decision formation, including by reducing harmful social-pressure effects on choices. While past behavior may not always directly drive intention, it influences decision pathways via attitudes. The paper underscores that building literacy can make investors more resilient and deliberate, improving the overall quality of decision-making in equity investment contexts.
7) Narasaraju (2025), In the research paper titled “Behavioral Biases and Investment Decision-Making in the Indian Stock Markets” This study highlights that behavioral biases (such as emotional and cognitive distortions) strongly shape investor decisions, but importantly, financial literacy moderates these effects meaning higher literacy reduces the damaging impact of biases on decisions. It also notes that investor experience plays a moderating role. The key takeaway is that improving technical/financial knowledge is not only useful for analysis, but also acts as a behavioral “shield,” supporting more stable and satisfactory decisions.
8) Gupta (2025), In the research paper titled “Financial Literacy as a Moderator in Behavioral Biases and Investment Decisions” The paper concludes that behavioral biases significantly influence investor decisions, but higher financial literacy helps investors recognize and overcome these biases, leading to more logical and well- informed decision-making. In effect, literacy improves decision discipline and reduces error-prone reliance on heuristics. This supports the argument that investor technical knowledge is central to both decision quality and the satisfaction investors feel after deciding.
9) Agrawal and Kannaujiya (2024), In the research paper titled “Technological Influences on Retail Investors’ Investment Decisions with Special Reference to Prayagraj District” The study concludes that technology (apps, online platforms, real-time data access, analytics tools) has empowered Indian retail investors by improving access to information and easing execution, thereby changing how decisions are made. At the same time, it stresses that technology only improves outcomes when investors are adequately educated about risks and how to interpret information. The implication for your topic is that technical knowledge plus digital access can jointly enhance decision confidence and satisfaction.
10) Subnani and Todwal (2024), In the research paper titled “Investor Education and Decision-Making in the Indian Stock Market: Empowering Users for Informed Trading” This study reports a positive association between investor education/financial literacy and better decision behavior, including improved diversification and reduced impulsive trading. It also emphasizes that emotional biases (fear, overconfidence) materially influence investor decisions, implying education must address both knowledge and behavioral control. Overall, the paper supports the idea that stronger investor technical knowledge improves decision quality and can raise satisfaction by lowering confusion and impulsive mistakes in the capital market.
2.1. Research Gap
A review of existing literature indicates that while substantial research has examined financial literacy, investor awareness, and behavioral biases in the context of investment decision-making, most studies in the Indian context focus either on specific financial instruments (such as mutual funds or equities) or on investment behavior and participation, rather than on investors’ technical knowledge and their post-decision satisfaction as an integrated construct. Moreover, many studies emphasize demographic determinants, risk tolerance, or behavioral biases without empirically linking technical market knowledge (such as understanding of market mechanisms, analysis tools, and trading processes) to satisfaction with investment decisions in the broader Indian capital market. There is also limited evidence capturing how enhanced technical understanding influences investor confidence, reduces decision regret, and improves perceived decision quality among retail investors. Additionally, region-specific and contemporary empirical studies reflecting the increasing role of digital trading platforms and information accessibility remain scarce. Hence, there exists a clear research gap in systematically evaluating the relationship between investor technical knowledge and satisfaction in investment decision-making within the Indian capital market, which the present study seeks to address.
3. Research Methodology
The present study adopted a descriptive and analytical research design to examine the relationship between investors’ technical knowledge and satisfaction with investment decision-making in the Indian capital market. Primary data were collected from 140 investors using a structured questionnaire, covering demographic details, investment behavior, technical analysis knowledge, technical knowledge, and satisfaction levels, measured on a Likert scale. The sample was selected using a convenience sampling method, focusing on individuals actively involved in capital market investments. The collected data were coded and analyzed using statistical tools such as Pearson correlation, multiple regression analysis, ANOVA, and Structural Equation Modeling (SEM) with the help of SPSS and SmartPLS software. These techniques were employed to test the formulated hypotheses, assess the strength and significance of relationships among variables, and evaluate the explanatory power of the model, ensuring a comprehensive understanding of the factors influencing investor satisfaction.
4. Data Analysis
Table 1
|
Table 1 The following Table Indicates the Demographic Factor of the Study |
||||
|
Sr.no |
Demographic Factor |
Category |
Frequency |
Percent |
|
|
|
Male |
83 |
59.3 |
|
1 |
Gender |
Female |
57 |
40.7 |
|
|
|
20-30 |
13 |
9.3 |
|
|
|
31-40 |
49 |
35.0 |
|
|
|
41-50 |
41 |
29.3 |
|
2 |
Age Group |
51-60 |
29 |
20.7 |
|
|
|
Above 60 Years |
8 |
5.7 |
|
|
|
Upto HSC |
2 |
1.4 |
|
|
|
Graduate |
42 |
30.0 |
|
3 |
Qualification |
Post Graduate |
58 |
41.4 |
|
|
|
Professional Degree |
38 |
27.1 |
|
|
|
Homemaker |
6 |
4.3 |
|
|
|
Business |
22 |
15.7 |
|
4 |
Occupation |
Private Employee |
29 |
20.7 |
|
|
|
Government Employee |
83 |
59.3 |
|
|
|
Less than 10 lacs |
40 |
28.6 |
|
5 |
Annual Income of family |
10 lacs to 20 lacs |
89 |
63.6 |
|
|
|
More than 20 lacs |
11 |
7.9 |
The demographic profile of the respondents reflects a diverse yet professionally inclined investor base. In terms of gender, male respondents (83) outnumber female respondents (57), indicating relatively higher participation of males in capital market investments. The age-wise distribution shows that the majority of respondents fall within the 31–40 years (49) and 41–50 years (41) age groups, suggesting that investors are largely in their economically active and wealth-building stages. Regarding educational qualifications, a substantial proportion of respondents are postgraduates (58) and professionally qualified (38), highlighting a well-educated sample with the potential to understand financial and technical investment concepts. Occupationally, government employees (83) form the largest group, followed by private employees (29) and businesspersons (22), indicating stable income sources among most investors. In terms of annual family income, the majority of respondents earn ₹10 lakhs to ₹20 lakhs (89), while 40 respondents fall below ₹10 lakhs and a smaller group (11) earns above ₹20 lakhs, suggesting a predominantly middle- to upper-middle-income investor segment with reasonable investment capacity in the Indian capital market.
The following table indicates investment frequency of
respondents:
Table 2
|
Table 2 Q.15. Your investment frequency in Indian Capital Market. |
||||
|
Frequency |
Percent |
Valid Percent |
Cumulative Percent |
|
|
Invested in past |
13 |
9.3 |
9.3 |
9.3 |
|
Rarely |
39 |
27.9 |
27.9 |
37.1 |
|
Sometimes |
23 |
16.4 |
16.4 |
53.6 |
|
Often |
46 |
32.9 |
32.9 |
86.4 |
|
Always |
19 |
13.6 |
13.6 |
100 |
|
Total |
140 |
100 |
100 |
|
The analysis of respondents’ investment frequency in the Indian capital market indicates varied levels of participation. A significant proportion of investors, 46 respondents, reported that they often invest, suggesting regular engagement and active interest in capital market activities. This is followed by 39 respondents who invest rarely, reflecting a cautious or selective investment approach. 23 respondents indicated that they sometimes invest, representing occasional participation based on market conditions or available surplus funds. A smaller group of 19 respondents stated that they always invest, highlighting a highly consistent and disciplined investment behavior. Meanwhile, 13 respondents have invested only in the past, implying discontinuation or withdrawal from regular capital market participation, possibly due to market experiences or changing financial priorities.
The following table indicates
percentage of your total investment invested:
Table 3
|
Table 3 Q. 16. What Percentage of your Total Investment do you Invest in Indian Capital Market? |
||||
|
Frequency |
Percent |
Valid Percent |
Cumulative Percent |
|
|
0 to 10% |
45 |
32.1 |
32.1 |
32.1 |
|
11% to 25% |
61 |
43.6 |
43.6 |
75.7 |
|
26% to 50% |
31 |
22.1 |
22.1 |
97.9 |
|
More than 50% |
3 |
2.1 |
2.1 |
100 |
|
Total |
140 |
100 |
100 |
|
The distribution of respondents based on the proportion of their total investment allocated to the Indian capital market shows that a majority of investors prefer a moderate exposure. The largest segment, 61 respondents, invests 11% to 25% of their total investment in the Indian capital market, indicating a cautious yet active participation. This is followed by 45 respondents who invest only 0% to 10%, reflecting a conservative investment approach and possible risk aversion. A smaller group of 31 respondents allocates 26% to 50% of their investments, suggesting higher confidence and engagement with capital market instruments. Only 3 respondents invest more than 50%, highlighting that very few investors are willing to commit a dominant share of their portfolio to the capital market, possibly due to perceived risk and market volatility.
Objective-1 to study relation between technical
analysis knowledge of Investment and satisfaction of investment in Indian
Capital Market.
Null Hypothesis H01: There is no relationship between technical analysis knowledge of Investment and satisfaction of investment in Indian Capital Market.
Alternate Hypothesis H11: There is a relationship between technical analysis knowledge of Investment and satisfaction of investment in Indian Capital Market.
To test the above null hypothesis, Pearson Correlation test is applied and results are as follows:
Table 4
|
Table 4 Correlations |
|||
|
Satisfaction |
Technical analysis knowledge |
||
|
Pearson Correlation |
1 |
.175* |
|
|
P-value |
0.039 |
||
|
Satisfaction |
N |
140 |
140 |
|
Pearson Correlation |
.175* |
1 |
|
|
Technical analysis
knowledge |
P-value |
0.039 |
|
|
N |
140 |
140 |
|
|
*. Correlation is significant at the 0.05 level
(2-tailed). |
|
|
|
Interpretation: The above results indicate that calculated p-value is 0.039. It is less than
0.05. Therefore Pearson Correlation test is rejected. Hence Null hypothesis is rejected and Alternate hypothesis is accepted.
Conclusion: There is a relationship between technical analysis knowledge of Investment and satisfaction of investment in Indian Capital Market.
Findings: The Pearson correlation analysis reveals a positive relationship between investor satisfaction and technical analysis knowledge, with a correlation coefficient of r = 0.175 based on 140 respondents. Although the strength of the relationship is weak, it is statistically significant at the 5% level, as indicated by the p-value of 0.039, which is less than 0.05. This result suggests that investors who possess higher levels of technical analysis knowledge tend to report slightly greater satisfaction with their investment decision- making. The finding implies that an understanding of technical indicators, price trends, and market patterns contributes to increased confidence and perceived effectiveness in investment decisions, thereby enhancing satisfaction, even though other factors may also play a substantial role.
Objective 2: to study impact of technological knowledge
on satisfaction of investment in Indian Capital Market.
Null Hypothesis H02: There is no impact of technological knowledge on satisfaction of investment in Indian Capital Market.
Alternate Hypothesis H12: There is a impact of technological knowledge on satisfaction of investment in Indian Capital Market.
To test the above null hypothesis, Pearson Correlation test is applied and results are as follows:
Table 5
|
Table 5 Correlations |
|||
|
Satisfaction |
Technical knowledge |
||
|
Pearson Correlation |
1 |
.552** |
|
|
Satisfaction |
P-value |
0 |
|
|
N |
140 |
140 |
|
|
Technical knowledge |
Pearson Correlation |
.552** |
1 |
|
P-value |
0 |
||
|
N |
140 |
140 |
|
|
**. Correlation is
significant at the 0.01 level (2-tailed). |
|
|
|
Interpretation: The above results indicate that calculated p-value is 0.000. It is less than
0.05. Therefore Pearson Correlation test is rejected. Hence Null hypothesis is rejected and Alternate hypothesis is accepted.
Conclusion: There is a impact of technological knowledge on satisfaction of investment in Indian Capital Market.
Findings: The Pearson correlation results indicate a strong and positive relationship between investor satisfaction and technical knowledge, with a correlation coefficient of r
= 0.552 based on a sample of 140 respondents. The relationship is highly statistically significant, as reflected by the p-value of 0.000, which is well below the 0.01 level of significance. This finding suggests that investors with higher levels of technical knowledge tend to experience substantially greater satisfaction with their investment decision-making. It implies that a sound understanding of market concepts, analytical tools, and investment mechanisms enhances confidence, reduces uncertainty, and leads to more informed and satisfying investment decisions in the Indian capital market.
5. Regression Model
Dependent Variable: Satisfaction
Independent Variable: Technical analysis knowledge, Technical knowledge
Table 6
|
Table 6 Model Summary |
||||
|
|
|
|
Adjusted R Square |
Std. Error of the
Estimate |
|
Model |
R |
R Square |
|
|
|
1 |
.556a |
.309 |
.299 |
15.215 |
|
a. Predictors: (Constant), Technical analysis knowledge,
Technical knowledge |
||||
The R Square value of 0.309 indicates that 30.9% of the variation in investor satisfaction (the dependent variable) is jointly explained by the independent variables technical analysis knowledge and technical knowledge. This suggests that investors’ understanding of market concepts, analytical tools, and technical indicators plays a substantial role in determining how satisfied they feel with their investment decision-making. The Adjusted R Square of
0.299 confirms that the model remains robust even after adjusting for the number of predictors, indicating minimal overfitting and good explanatory power. Overall, the model demonstrates that technical competencies meaningfully contribute to investor satisfaction, while the remaining variation may be influenced by other factors such as behavioral biases, risk perception, market experience, and external advice.
Table 7
|
Table 7 ANOVAa |
||||||
|
Model |
Sum of Squares |
df |
Mean Square |
F |
P-value |
|
|
1 |
Regression |
14197.28 |
2 |
7098.64 |
30.664 |
.000b |
|
Residual |
31715.406 |
137 |
231.499 |
|||
|
Total |
45912.686 |
139 |
||||
|
a. Dependent Variable: Satisfaction |
||||||
|
b. Predictors: (Constant), Technical analysis
knowledge, Technical knowledge |
|
|||||
Above results indicates that p-value is 0.000. It is less than 0.05. It indicates that linear regression model is good to fit.
Table 8
|
Table 8 Coefficientsa |
||||||
|
|
|
Unstandardized Coefficients |
|
Standardized Coefficients |
|
|
|
Model |
|
B |
Std. Error |
Beta |
t |
P-value |
|
1 |
(Constant) |
32.137 |
7.32 |
|
4.39 |
0 |
|
|
Technical knowledge
(TK) |
0.566 |
0.076 |
0.582 |
7.435 |
0 |
|
a. Dependent Variable:
Satisfaction (S) |
||||||
Above table indicate the values of coefficients and corresponding significance. According to p-value of the Satisfaction it is observed that except “Technical knowledge” and “Technical analysis knowledge” remaining variables has significant impact on Satisfaction. The mathematical equation to estimate the Satisfaction is presented as follows:
S= 32.137 + 0.566*TK - 0.098*TAK
6. Structural Equation Modelling
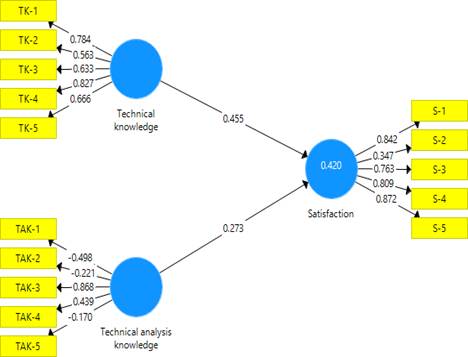
Table 9
|
Table 9 Path Coefficients |
|
|
Technical analysis |
0.273 |
|
knowledge |
|
|
Technical knowledge |
0.455 |
The path coefficients indicate the strength and direction of influence of the independent variables on the dependent variable, Satisfaction. The coefficient for Technical Knowledge (β = 0.455) is relatively strong and positive, showing that overall technical understanding of the capital market has a substantial impact on investor satisfaction. In comparison, Technical Analysis Knowledge (β = 0.273) also has a positive effect but with a comparatively lower magnitude. This implies that while familiarity with technical analysis tools and indicators contributes to satisfaction, broader technical knowledge related to market functioning, trading mechanisms, and investment concepts plays a more dominant role in shaping investors’ satisfaction with their decision-making.
Table 10
|
Table 10 Outer Loadings |
|||
|
Satisfaction |
Technical analysis knowledge |
Technical knowledge |
|
|
S-1 |
0.842 |
||
|
S-2 |
0.347 |
||
|
S-3 |
0.763 |
||
|
S-4 |
0.809 |
||
|
S-5 |
0.872 |
||
|
TAK-1 |
-0.498 |
||
|
TAK-2 |
-0.221 |
||
|
TAK-3 |
0.868 |
||
|
TAK-4 |
0.439 |
||
|
TAK-5 |
|
-0.17 |
|
|
TK-1 |
|
|
0.784 |
|
TK-2 |
|
|
0.563 |
|
TK-3 |
|
|
0.633 |
|
TK-4 |
|
|
0.827 |
|
TK-5 |
|
|
0.666 |
Outer loadings represent how well each observed indicator reflects its respective latent construct. For the Satisfaction construct, most indicators (S-1, S-3, S-4, and S-5) show strong loadings above the acceptable threshold of 0.70, indicating good reliability and strong representation of the construct, whereas S-2 shows a relatively weak loading, suggesting it contributes less effectively. In the Technical Analysis Knowledge construct, TAK-3 exhibits a strong positive loading, indicating it is the most representative item, while TAK-1, TAK-2, and TAK-5 show negative or weak loadings, suggesting possible issues with item wording, reverse coding, or conceptual alignment. For Technical Knowledge, all indicators (TK-1 to TK-5) display moderate to strong positive loadings, demonstrating that these items reliably capture the broader technical knowledge construct.
Table 11
|
Table 11 Outer Weights |
|||
|
|
Satisfaction |
Technical analysis knowledge |
Technical knowledge |
|
S-1 |
0.309 |
|
|
|
S-2 |
0.086 |
|
|
|
S-3 |
0.248 |
|
|
|
S-4 |
0.318 |
|
|
|
S-5 |
0.302 |
|
|
|
TAK-1 |
|
-0.333 |
|
|
TAK-2 |
|
-0.13 |
|
|
TAK-3 |
|
0.748 |
|
|
TAK-4 |
|
0.313 |
|
|
TAK-5 |
|
-0.112 |
|
|
TK-1 |
|
|
0.331 |
|
TK-2 |
|
|
0.195 |
|
TK-3 |
|
|
0.19 |
|
TK-4 |
|
|
0.415 |
|
TK-5 |
|
|
0.252 |
Outer weights reflect the relative importance of each indicator in forming the latent variable in the model. For Satisfaction, indicators S-1, S-4, and S-5 have higher weights, indicating they contribute more substantially to the overall satisfaction construct, while S-2 has minimal influence. In the Technical Analysis Knowledge construct, TAK-3 again emerges as the most influential indicator with the highest positive weight, whereas negative weights for TAK-1, TAK-2, and TAK-5 indicate weaker or potentially problematic contributions that may require refinement or removal. For Technical Knowledge, TK-4 carries the highest weight, highlighting it as the most critical indicator, followed by TK-1 and TK-5, collectively suggesting that these items strongly shape the overall technical knowledge construct used to explain investor satisfaction.
7. Conclusion
The study concludes that investor satisfaction in the Indian capital market is meaningfully influenced by the level of technical competence possessed by investors. The demographic profile indicates a predominantly well-educated, professionally employed, and middle- to upper-middle-income group, suggesting adequate capacity and exposure to capital market investments. Empirical results reveal that while technical analysis knowledge has a positive but weak relationship with satisfaction, overall technical knowledge exhibits a strong and highly significant impact on investor satisfaction. The regression and structural equation modeling results further confirm that technical knowledge is the most influential predictor of satisfaction, explaining a substantial proportion of variation in investors’ perceived decision quality, whereas technical analysis knowledge plays a comparatively supportive role. Overall, the findings suggest that a broader understanding of market mechanisms, investment processes, and technological aspects of trading enhances investor confidence, reduces uncertainty, and leads to more informed and satisfying investment decisions. The study highlights the importance of strengthening investors’ technical knowledge through education and awareness initiatives to improve satisfaction and effectiveness in participation within the Indian capital market.
CONFLICT OF INTERESTS
None.
ACKNOWLEDGMENTS
None.
REFERENCES
Agrawal, P., and Kannaujiya, R. (2024). Technological Influences on Retail Investors’ Investment Decisions with Special Reference to Prayagraj District. International Journal of Research and Analytical Reviews, 11(1), 45–52.
Baker, H. K., Kumar, S., Goyal, N., and Gaur, V. (2019). How Financial Literacy and Demographic Variables Relate to Behavioral Biases. Managerial Finance, 45(1), 124–139. https://doi.org/10.1108/MF-01-2018-0003
Bhushan, P., and Medury, Y. (2014). Financial Literacy and its Determinants. International Journal of Engineering, Business and Enterprise Applications, 4(2), 155–160.
Gupta, S. (2025). Financial Literacy as a Moderator in Behavioral Biases and Investment Decisions. International Journal of Financial Studies, 13(2), 112–125. https://doi.org/10.3390/ijfs13020112
Klapper, L., Lusardi, A., and van Oudheusden, P. (2015). Financial Literacy Around the World: Insights from the Standard & Poor’s Ratings Services Global Financial Literacy Survey. Journal of Consumer Affairs, 49(1), 1–28. https://doi.org/10.1111/joca.12044
Lusardi, A., and Mitchell, O. S. (2014). The Economic Importance of Financial Literacy: Theory and Evidence. Journal of Economic Literature, 52(1), 5–44. https://doi.org/10.1257/jel.52.1.5
Mishra, P. K. (2018). Financial Literacy, Risk Tolerance and Stock Market Participation. International Journal of Emerging Markets, 13(5), 1289–1308. https://doi.org/10.1108/IJoEM-11-2016-0308
Nag, S., and Prathap, G. (2025). Financial Literacy and Investor Satisfaction: A Behavioral Study
Among Retail Investors in Karnataka. Journal of Behavioral Finance, 26(1),
78–92.
Narasaraju, Y. (2025). Behavioral Biases and Investment Decision-Making in the Indian stock
markets. International Journal of Economics and Financial Issues, 15(1),
96–104.
Patil, S., and Bagodi, V. (2021). A Study of Factors Affecting Investment Decisions in India: The KANO
way. *Journal of Management Research and Analysis, 8(2), 65–73.
Prasad, R. (2025). A Study of Evaluating Investor Technical Knowledge of Mutual Funds and Satisfaction of Decision Making. International Journal of Commerce and Management Research, 11(1), 23–29.
Raut, R. K. (2020). Past Behaviour, Financial Literacy and Investment Decision-Making Process of Individual Investors. International Journal of Emerging Markets, 15(6), 1243–1263. https://doi.org/10.1108/IJOEM-07-2018-0379
Sehrawat, M., and Giri, A. K. (2015). Financial Literacy and Financial Inclusion: Evidence from India. International Journal of Social Economics, 42(8), 676–699. https://doi.org/10.1108/IJSE-02-2013-0030
Singh, A., and Gupta, S. (2021). The Impact of Financial Literacy on Investor Attitudes and Decision-Making: An Empirical Analysis. Journal of Finance and Accountancy, 25(1), 1–15.
Subnani, M., and Todwal, R. (2024). Investor Education and Decision-Making in the Indian Stock Market: Empowering Users for informed trading. Asian Journal of Economics and Banking, 8(3), 210–225. https://doi.org/10.1108/AJEB-02-2024-0021
|
|
 This work is licensed under a: Creative Commons Attribution 4.0 International License
© ShodhKosh 2026. All Rights Reserved.