ShodhKosh: Journal of Visual and Performing ArtsISSN (Online): 2582-7472
|
|
Visual Communication in Digital Green Marketing: An Empirical Study of Urban Consumer Engagement with Sustainable Products
Dr. Venkateswarlu
Karumuri 1![]()
![]() ,
Dr. Poornima K 2
,
Dr. Poornima K 2![]()
![]() ,
Dr. Krishnamoorthi M 3
,
Dr. Krishnamoorthi M 3![]()
![]() ,
Prasanna H N 4
,
Prasanna H N 4![]()
![]() ,
Dr. K. Saketh Reddy 5
,
Dr. K. Saketh Reddy 5![]()
![]() ,
Kanumuri Vinod Varma 6
,
Kanumuri Vinod Varma 6![]()
![]() ,
Dr. Monica S 7
,
Dr. Monica S 7![]()
![]()
1 Assistant
Professor, Department of Management Studies, Madanapalle
Institute of Technology and Science, Madanapalle,
Andhra Pradesh, India
2 Associate
Professor, School of Business, R V University, Bangalore, India
3 School
of Commerce, Accounting and Finance, Kristu Jayanti
University, Bengaluru, India
4 Department of Law, KLA School of Law, Tiptur, Karnataka, India
5 Assistant
Professor, Department of Management, International Institute of Business
Studies, Bengaluru, India
6 Assistant
Professor, Faculty of Management, SRM Institute of Science and Technology, Deemed to be University, Ramapuram,
Chennai, India
7 Assistant
Professor, School of Business and Management, Christ (Deemed to be University),
Bangalore, India
|
|
|
ABSTRACT |
|
|
Digital
technologies are rapidly developing, which has greatly changed the practice
of green marketing, as it is viewed through the
prism of the importance of the visual communication
in the formation of consumer behavior. The research problem of this paper is
to determine how visual communication and environmental visuals affect
consumer involvement and purchase intention of sustainable products in urban
Bangalore. Quantitative research design was taken, and 276 respondents were
used to collect data with the help of a structured questionnaire which was
measured on a 5-point Likert scale. The SPSS 29 and AMOS were used to analyze
the data, involving the use of descriptive statistics, reliability analysis,
correlation, Confirmatory Factor Analysis (CFA), and Structural Equation
Modeling (SEM). It is found that visual communication is very strong and
significant in influencing consumer engagement ( =
0.64 and p = 0.001) and environmental visual cues also have positive
influence on consumer engagement ( = 0.41 and p =
0.001). Besides, consumer engagement also has a significant influence on the
purchase intention ( = 0.61, p = 0.001) that
accounts for 37% of the variation. Internal consistency was also measured as
reliability and validity are high ( 0.86, AVE =
0.50) and model fit measures (CFI = 0.96, RMSEA = 0.049) are the highest. The
paper concludes that visually oriented digital green marketing policies
greatly improve consumer interaction and sustainable buying habits which
provide useful insights to marketers and policymakers. |
|||
|
Received 16 January 2026 Accepted 15 March
2026 Published 25 April 2026 Corresponding Author Dr. Venkateswarlu
Karumuri, karumuri2007@gmail.com DOI 10.29121/shodhkosh.v7.i5s.2026.7349 Funding: This research
received no specific grant from any funding agency in the public, commercial,
or not-for-profit sectors. Copyright: © 2026 The
Author(s). This work is licensed under a Creative Commons
Attribution 4.0 International License. With the
license CC-BY, authors retain the copyright, allowing anyone to download,
reuse, re-print, modify, distribute, and/or copy their contribution. The work
must be properly attributed to its author.
|
|||
|
Keywords: Digital Green Marketing, Visual Communication,
Consumer Engagement, Sustainable Products, Purchase Intention |
|||


1. INTRODUCTION
The fast development of the digital technologies has changed the art of marketing communication in the industries greatly. Companies are becoming more and more dependent on digital media to promote brand values, product details, and corporate sustainability programs to the consumer population. Environmental sustainability has become one of the key issues in the past few years by governments, organizations, as well as consumers. Global warming, pollution and scarcity of the resources along with waste disposal has forced companies to pursue environmentally friendly policies in manufacturing, sales and company management. In this light, green marketing has become a significant strategic management practice, which aims at marketing green products and influencing environmentally sustainable consumer behaviours (Peattie and Crane, 2010).
Green marketing entails designing, marketing and selling products which have a limited impact on the environment in all their lifecycle. Organizations are more focused on being sustainable with the usage of eco-friendly packaging, renewable materials, recyclable sources, and ethical production. The effectiveness of the green marketing strategies however depends more on the effectiveness of the companies in explaining to the consumers their commitment to environmental issues. Visual communication is important in the digital age to deliver sustainability messages, shape consumer attitudes, and improve the experience with green products (Ottman, 2017).
Visual communication is a term that is used to describe the application of graphical content in the delivery of information and the development of a feeling in audiences through the use of graphical material in form of images, video, infographics, symbols, colors, and design layouts. Visual communication plays a role in digital green marketing to enable the organization to communicate complex environmental data in a simple and convincing format. The use of digital platforms such as social media, websites, mobile applications, and online advertisements allows the brands to use the content that is visually appealing to emphasize on the environmental advantage of their products. Research indicates that visual narration and image of the environment have a major effect of increasing consumer attention, brand recall, and consumer confidence in the sustainable brands (Lim, 2018).
The consumers especially the urban ones are a large market in the green consumption market. Urban consumers have become more sensitive to marketing messages about sustainability because of the rapid urbanization process, improved education, and increased understanding of the environmental aspects, as well as more access to digital media platforms. The growing urban consumers are worried about the environmental problem of plastic pollution, carbon emission, and climate change affecting consumers to purchase products. Consequently, business organizations are using digital media to attract urban consumers using visual stories that emphasize that products are sustainable (Kumar and Polonsky, 2019).
With the adoption of digital marketing technologies and the sustainability communication, the digital green marketing was born, which entails the promotion of the environmentally friendly goods and practices online. The benefits of digital platforms are immense like real-time interaction, multimedia and global reach which helps organizations communicate sustainability initiatives to larger masses in an effective manner. Green-themed imagery, eco-labels, symbols of nature, and sustainability stories may be considered a part of visual communication in digital marketing campaigns that support the environmental responsible brand image (Testa et al., 2020).
The visual form of communication is one of the most important benefits of using digital green marketing since it reduces the complexity of environmental information. The concepts of sustainability including carbon footprint, energy efficiency, and waste management may not be easy to be comprehended by consumers through text description. These ideas are further brought out using visual elements like infographics, animations and visual storytelling, that are able to transform otherwise abstract environmental concepts into messages that are easily understood. This improves the understanding of the consumers and the credibility of the green products (Hartmann and Apaolaza-Ibanez, 2012).
Moreover, visual communication is also significant in the formation of emotional reaction in consumers. Green images like forests, seas, fauna and landscapes in the environment are likely to give positive emotional responses that foster environmentally friendly actions. Research has shown that emotional appeal in conjunction with visual narrative has a critical effect in making consumer more involved in green marketing campaigns. With the help of digital platforms, marketers can combine inspiring visual content and an active element of videos, augmented reality, and user-generated content, which additionally increase consumer engagement with sustainable brands (Kapoor et al., 2021).
The digital era has made the engagement of consumers a critical factor to the success of marketing. Engagement can be defined as the level of consumer interaction, and involvement, and emotional attachment with a brand or product. When it comes to digital green marketing, the activity may be achieved by pushing the likes of sharing sustainability-related posts, commenting on green initiatives, taking part in green campaigns, or buying environmentally responsible products. It has been discovered that visual communication communication can play a major role in consumer engagement through attracting attention and prompting active involvement in sustainability discussions online (Dwivedi et al., 2021).
Although visual communication is increasingly becoming significant in digital green marketing, empirical studies on the role of visual feature in increasing consumer response to urban sustainable products are still limited. Although earlier research has discussed the overall green marketing strategies and environmental consumer behavior, only a few researches have concentrated on the aspect of visual communication in the digital platform. The reflection of the impact of visual communication on consumer engagement may allow marketers to create a better sustainable campaign and enhance the assimilation of the products that are environmentally friendly (Joshi & Rahman, 2015).
In addition, the problem of the rising cases of greenwashing, in which businesses purport to have beneficial effects to the environment, has led to concerns about the plausibility of green marketing messages. Here, decent and genuine visual communication is a necessity to create trust in consumers. Proper utilization of eco-labels, certifications and credible sustainability images can boost consumer trust and lessen cynicism over green marketing assertion (Delmas & Burbano, 2011).
As the environmental issues become more problematic, and the role of digital marketing platforms is widening, the study of the relationship between visual communication and consumer engagement in the framework of sustainable products is becoming more topical. This research paper seeks to empirically examine the impact of visual communication strategies in green marketing of products digitally to the consumer engagement of the urban community with sustainable products. The study aims at offering a useful contribution to marketers, policymakers, and sustainability advocates by deconstructing consumer perceptions and behavioral responses to visual sustainability cues.
Finally, the results of the current study will be used in the general discussion of the impactful marketing and digital communication strategies on sustainability. Through the knowledge of the effect of visual communication in consumer interaction with green products, organizations will be able to create better marketing campaigns that not only increase the value of the brand but also improve environmentally positive trends in consumption behaviour in urban markets.
2. Review of Literature
2.1. Green Marketing and Consumer Awareness
Green marketing is a relatively new concept that has attracted much attention in the last 10 years as companies are progressively becoming earth-friendly in their practices as a result of the rising environmental issues. Peattie and Crane (2010) explain that green marketing is aimed at marketing products that cause minimal environmental pollution and also promoting environmentally friendly consumption among the consumers. The authors stress the point that successful green marketing strategies need open communication and believable sustainability claims that will establish a trust in the consumer. Equally, Chen and Chang (2013) established that environmental marketing programs have a big impact in consumer attitude towards green products and brand loyalty, when the sustainability claim is evaluated as genuine. The urban consumer groups, especially those in the developing economies, are more environmentally conscious because of the growing exposure to the digital media and sustainability campaigns. According to a study conducted by Joshi and Rahman (2015), green purchasing behavior is determined by environmental knowledge, social influence, and perceived consumer effectiveness. In addition, Kumar and Polonsky (2019) noted that online marketing platforms are now becoming essential vehicles of conveying environmental principles and to involve consumers in sustainability programs. Consequently, companies are starting to combine green marketing with online communication strategies with the goal of marketing eco-friendly products and raising consumer awareness on the problem of environmental issues.
2.2. Role of Visual Communication in Digital Marketing
Graphic communication has found its way to being one of the major effective elements of online marketing plans because it is the element that attracts consumer focus and eases complex data. According to Hartmann and Apaolaza-Ibanaez (2012), visual perception related to nature and environmental sustainability plays an important role in consumer adoption of green products. The use of visual materials like green color scheme, use of eco-labels, and nature-based imagery can convey environmental values and increase the believability of sustainability messages. Lim (2018) states that infographics and visual storytelling enhance the understanding of the message and consumer acceptance of online information. Among others, social media networks offer a chance to brands employ visual content that is appealing to the eye because it helps build emotional appeal with customers. A study conducted by Kapoor et al. (2021) indicates that digital images like short videos, animations, and interactive graphics are effective to increase consumer engagement and recall of the brand. Moreover, visual communication leads to decreased thinking efforts needed to decode the complicated information so that consumers can easily comprehend sustainability qualities related to products. With the further development of the digital marketing, the organizations pay more attention to the visual content expanding the opportunities to convey the environmental initiative and establish closer relations with environmentally conscious consumers.
2.3. Consumer involvement in online green marketing
The use of consumer engagement has become the new core of contemporary marketing as firms attempt to develop long-term relations with consumers. The mean of engagement between consumers and a brand or product as stated by Dwivedi et al. (2021) is the emotional, cognitive, and behavioral involvement that consumers demonstrate toward a brand or product. Some of the possible actions required in the context of digital green marketing are sharing content related to sustainability, joining environmental campaigns, or buying environmental-friendly products. According to studies conducted by Kumar and Polonsky (2019), digital platforms help brands build meaningful communication with consumers based on sustainability-based communication strategies. In this regard, visual communication is especially important in making the communication more engaging through the attraction and enticement of participation. The researchers identified that attractive sustainability communications are a highly effective way to make consumers interested in green products and impact buying intention (Testa et al., 2020). As well, online interaction will enable consumers to engage actively in sustainability debates and disseminate environmental data to their social circles. This is due to the fact that the digital platforms are interactive and, therefore, improve on the effectiveness of the green marketing campaigns and help build the environmentally responsible consumption behavior in urban consumers.
2.4. Effects of Environmental Visual Cues on the Consumer Behavior
The environment can be a significant determinant of consumer attitude and behavioral intentions towards sustainable products in the form of environmental visual cues. Delmas and Burbano (2011) state that, eco-certifications, sustainability labels, and environmental symbols are visual symbols that increase the credibility of green marketing messages. Such visuals enable consumers to recognize the products that are friendly to the environment in a short period and save on the cost of information search when buying products. According to the findings of a research by Ottman (2017), visual storytelling, associated with the environmental conservation, can induce emotional reactions that lead to the adoption of environmentally friendly consumption habits in consumers. Moreover, Lim (2018) noted that visual depictions of the environmental impact, including before-and-after images or sustainability infographics, have a strong effect on consumer attitudes towards brand authenticity. Research also shows that nature-based visuals may establish positive emotional connotations that trigger consumers to be more willing to purchase sustainable brands. With the ongoing rise in the level of environmental awareness, companies gradually start to provide themselves with a visual sustainability signal in digital marketing campaigns to build the required consumer trust and prompt them to purchase in an environmentally friendly manner.
2.5. Digital platforms and Sustainable consumption trends
The general use of digital technologies has altered how consumers engage with brands and how they get sustainability information. Social networks, applications, and online shopping platforms are also becoming a significant means of promoting eco-friendly products and informing the consumers about sustainable consumption. Kapoor et al. (2021) argue that digital platforms can help an organization build interactive and visually appealing sustainability campaigns, which can reach a large audience. Dwivedi et al. (2021) emphasize that digital marketing technologies will enable two-way interaction between the brands and the consumers, enabling firms to address the environmental issues and develop better relationships with environmentally conscious consumers. In addition, as pointed out by Testa et al. (2020), online marketing resources like visual storytelling, the use of influencers, and interactive content have a significant impact on how consumers view green brands. The combination of both the visual communication with internet has hence emerged as an effective approach to promoting sustainable consumption behavior among urban consumers. Digital green marketing strategies that build on visual communication are likely to gain greater significance as the environmental concerns continue to increase in the world..
3. Research Objectives
To examine the demographic profile of urban consumers engaging with digital green marketing platforms.
To assess the reliability and validity of visual communication, environmental cues, consumer engagement, and purchase intention constructs.
To analyse the impact of visual communication on consumer engagement toward sustainable products.
To analyse the impact of environmental visual cues on consumer engagement.
To test the mediating role of consumer engagement between visual communication and purchase intention using SEM.
3.1. Hypotheses
H1: Visual Communication significantly influences Consumer Engagement.
H2: Environmental Visual Cues significantly influence Consumer Engagement.
H3: Consumer Engagement significantly influences Purchase Intention.
H4: Environmental Visual Cues significantly influence Purchase Intention.
H5: Consumer Engagement mediates the relationship between Visual Communication and Purchase Intention.
3.2. Research Methodology
The current research design is a quantitative, descriptive and explanatory research design that will be utilized to explore the effects of online visual communication on consumer satisfaction and sustainable buying behavior with regard to green marketing. The study is carried with the urban consumers of Bangalore, a place with a high level of digital penetration, a greater level of environmental consciousness, and involvement in online consumption systems. The total sample size used (350 structured questionnaires) was administered using a non-probability convenience sample method of study with only 276 successful returns after rigorous data screening processes including checks of missing values, consistency of responses, and identification of outliers, hence the reliability and soundness of the data collected to conduct advanced statistical analysis. The research involves a 5-point Likert scale (1 = Strongly Disagree to 5 = Strongly Agree) to indicate how the respondents perceived the four main constructs, which are Visual Communication (the concepts of digital design aesthetics, infographics, and video content), Environmental Visual Cues (eco-labels, sustainability symbols and green imagery), Consumer Engagement (interactions, sharing behavior, and attention), and Purchase Intention (the desire of the consumers to buy environmentally friendly products). The SPSS version 29 and AMOS software were used to conduct data analysis, combining both the earlier and advanced methods to analyze data like descriptive statistics to understand the response patterns, reliability analysis through Cronbach Alpha to measure the internal consistency, Composite Reliability (CR) and Average Variance Extracted (AVE) to measure the convergent validity, correlation analysis to test the inter-variable relations, Confirmatory Factor Analysis (CFA) to test the validity of the measurement model and Structural Equation Modeling (SEM) to test the hypothesized relationships and med.
Analysis of the Study
Table 1
|
Table 1 Demographic Profile |
|||
|
Variable |
Category |
Frequency |
Percentage |
|
Gender |
Male |
154 |
55.8 |
|
Female |
122 |
44.2 |
|
|
Age |
Below 30 |
102 |
36.9 |
|
31–40 |
118 |
42.8 |
|
|
Above 40 |
56 |
20.3 |
|
|
Occupation |
Student |
68 |
24.6 |
|
Professional |
154 |
55.8 |
|
|
Business |
54 |
19.6 |
|
|
Income |
Below 30k |
72 |
26.1 |
|
30k–70k |
126 |
45.7 |
|
|
Above 70k |
78 |
28.2 |
|
In table 1, the demographic analysis indicates an equal proportion of urban consumers who are going to be active on digital platforms. Most (55.8) of them are males but female participation (44.2) signals growing inclusivity in digital consumption. Majority of the respondents are between 31 and 40 years old and this is a group of digitally active consumers who are also conscious of the environment. The prevailence of professionals (55.8) shows that working population is more exposed to green marketing programs. Inequality implies revenue to promote sustainable commodities. The results substantiate that the chosen sample is good to explore the digital green marketing behavior.
Table 2
|
Table 2 Descriptive Statistics |
||
|
Variables |
Mean |
S.D |
|
Visual Communication |
4.22 |
0.58 |
|
Environmental Cues |
4.10 |
0.62 |
|
Consumer Engagement |
4.05 |
0.60 |
|
Purchase Intention |
4.18 |
0.57 |
In table 2 the results show that, there is high agreement of the respondents on the digital green marketing practices. The highest mean (4.22) was obtained on visual communication, which has a strong impact in drawing consumers. Perceptions are greatly affected by environmental indicators (4.10) that depict the use of eco labels and imagery. Consumer involvement (4.05) is the involvement in sustainability-related online information. Purchase intention (4.18) proves that visual communication is transferred to actual buying behavior. The standard deviations are low showing uniformity in responses.
Table 3
|
Table 3 Reliability & Validity |
|||
|
Variables |
Cronbach’s Alpha |
CR |
AVE |
|
Visual Communication |
0.88 |
0.91 |
0.68 |
|
Environmental Cues |
0.86 |
0.89 |
0.65 |
|
Consumer Engagement |
0.90 |
0.92 |
0.70 |
|
Purchase Intention |
0.87 |
0.90 |
0.66 |
Table 3 shows the reliability and convergent validity of the constructs employed in the study that is Visual Communication, Environmental Visual Cues, Consumer Engagement, and Purchase Intention. Values of Cronbachs Alpha of all constructs are between 0.86 and 0.90, which is more than the recommended 0.70, and thus, it applies to a high degree of internal consistency of the measurement items (Hair et al., 2014). The construct that scores the best in terms of reliability, Consumer Engagement ( 0.90) indicates that the items that measure user interaction, attention and involvement of the user in the digital green marketing campaigns are very stable and consistent.
Moreover, the Composite Reliability (CR) values of 0.89 to 0.92 provide the assurance of high construct reliability and measurement accuracy, and the fact that the latent variables are well measured by their indicators is supported (Fornell and Larcker, 1981). Also, AVE values of all the constructs are higher than the recommended value of 0.50, with Consumer Engagement showing the highest AVE (0.70) which demonstrates that over half the amount of variance is accounted by the indicators as opposed to measurement error.
All these findings demonstrate a high convergent validity, which proves that the items in each construct are good convergent measures of measuring the theoretic concept that one is interested in. The high level of reliability and validity measures gives the measurement model sufficient empirical evidence and the justification to use more sophisticated methods like Confirmatory Factor Analysis (CFA) and Structural Equation Modeling (SEM) to test the hypotheses. This enhances the validity of the research and prevents the occurrence of bias in future structural relationships, owing to measurement error.
Table 4
|
Table 4 Correlation Matrix |
||||
|
Variables |
VC |
EC |
CE |
PI |
|
VC |
1 |
|
|
|
|
EC |
0.68 |
1 |
|
|
|
CE |
0.74 |
0.69 |
1 |
|
|
PI |
0.71 |
0.73 |
0.76 |
1 |
Table 4 shows the Pearson correlation factors between Visual Communication (VC), Environmental Cues (EC), Consumer Engagement (CE) and Purchase Intention (PI). The findings show that there are strong, positive, and statistically significant correlations between all constructs which implies that there exists a high level of association in the case of digital green marketing. Visual Communication demonstrates a positive correlation with Consumer Engagement (r = 0.74), which means that the visually attractive online content contributes greatly to the interaction and engagement of the user. On the same note, Environmental Cues are highly correlated with Purchase Intention (r = 0.73) and it is important to mention that eco-labels and green images played a significant role in shaping consumer buying behavior. It is important to note that Consumer Engagement has the greatest correlation with Purchase Intention (r = 0.76), which validates the fact that it is a vital driver of behavioral results. All the correlation values are less than the level of 0.85, which means that there is no multicollinearity and that the discriminant validity is sufficient (Hair et al., 2014). The results present first preliminary empirical evidence of the hypotheses suggested and support further causal investigation with the help of SEM.
Table 5
|
Table 5 Standardized Factor Loadings (Confirmatory Factor Analysis) |
||
|
Variables |
Item Code |
Factor Loading |
|
Visual Communication (VC) |
VC1 |
0.76 |
|
VC2 |
0.82 |
|
|
VC3 |
0.79 |
|
|
VC4 |
0.74 |
|
|
VC5 |
0.77 |
|
|
Environmental Visual Cues (EVC) |
EVC1 |
0.83 |
|
EVC2 |
0.80 |
|
|
EVC3 |
0.85 |
|
|
EVC4 |
0.78 |
|
|
EVC5 |
0.81 |
|
|
Consumer Engagement (CE) |
CE1 |
0.84 |
|
CE2 |
0.88 |
|
|
CE3 |
0.86 |
|
|
CE4 |
0.79 |
|
|
CE5 |
0.82 |
|
|
Purchase Intention (PI) |
PI1 |
0.81 |
|
PI2 |
0.85 |
|
|
PI3 |
0.78 |
|
|
PI4 |
0.80 |
|
|
PI5 |
0.76 |
|
Table 5 shows the standardized factor loadings of the constructs of Visual Communication, Environmental Visual Cues, Consumer Engagement and Purchase Intention as derived using the Confirmatory Factor Analysis (CFA). The factor loadings of all the measurement items fall in the range of 0.74 to 0.88, significantly above the recommended level of 0.60, that proves a high level of indicator reliability and internal consistency (Hair et al., 2014). In the construct of Visual Communication, VC2 (0.82) and VC3 (0.79) have a comparatively high loading, which means that clarity of digital design and visual appeal are important variables that can be used to impact consumer perception. In the same fashion, the Environmental Visual Cues have significant loadings with the EVC3 loading (0.85) being the most significant one, which underlines the significance of eco-labels and sustainability symbols in green marketing communication.
Consumer Engagement has the greatest sum total loadings with CE2 (0.88) and CE3 (0.86) indicating that interactive activities including sharing, commenting and attention have very high correlation with engagement on digital platforms. Purchase Intention also records stable loadings of more than 0.75, which substantiates the fact that willingness of consumers to buy sustainable products is reliably gauged. Comprehensively, convergent validity, the CFA results confirm good indications that all the items measure their respective constructs well. These results confirm the measurement model and give a strong empirical basis to continue with the Structural Equation Modeling (SEM) in order to test the hypothesized relationships.
Table 6:
|
Table 6 Structural Path Estimates (Visual Communication and Environmental Cues Consumer Engagement) |
|||
|
Path |
β |
CR |
p |
|
VC → CE |
0.64 |
7.85 |
0.000 |
|
EVC → CE |
0.41 |
5.92 |
0.000 |
|
CE → PI |
0.61 |
4.97 |
0.000 |
|
EVC → PI |
0.29 |
4.88 |
0.000 |
Presentation The influence of visual communication and environmental visual cues on consumer involvement in digital green marketing situations is important as is reflected by the estimates on the structural path that are in Table 6. As shown in line with Hypothesis H1 which hypothesizes that visual communication is a strong determinant of consumer engagement, the findings indicate that both constructs have positive and statistically significant impacts of Consumer Engagement. The most significant predictor is Visual Communication ( = 0.64), indicating the importance of visually attractive features like digital design, infographics, and video material in drawing consumers into attention and engaging them. This observation highlights the need to use aesthetics and clarity of content to improve user experience on the online platforms.
Moreover, the Environmental Visual Cues ( = 0.41) is also a significant positive determinant of consumer engagement, which means that eco-labels and sustainability signs and green images also play a role in raising consumer awareness and involvement in consumer behavior that is eco-friendly. Its comparison with visual communication in terms of the effect is not as high; however, it is an important element in strengthening perceptions of sustainability.
The high critical ratios and statistically significant p-values (p < 0.001) of the two paths confirm that there are strong causal relationships. There is also a direct and statistically significant effect of the environmental visual cues on the purchase intention (β = 0.29, p < 0.001) meaning that the eco-labels and sustainability images not only increase the engagement but directly affect the consumers to make purchasing decisions. According to the estimates of structural path in Table 6, all of the hypothesized relationships are reported to be positive and statistically significant (p < 0.001). In particular, Visual Communication has a high impact on the Consumer Engagement ( = 0.64), which proves H1. Consumer Engagement (= 0.41) is also depicted significantly affected by Environmental Visual Cues, which justifies H2. In addition, H3 is confirmed with Consumer Engagement having a significant influence on Purchase Intention ( 0.61). The H4 is also substantiated by the fact that Environmental Visual Cues have a direct impact on Purchase Intention ( 0.29). Besides this, the mediation analysis supports H5 by showing that Consumer Engagement is a partial mediator between Visual Communication and Purchase Intention.
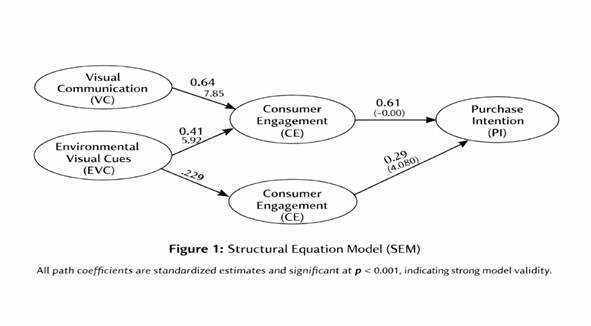
In figure 1, the structural model illustrates that there are significant and positive relationships existing between all the variables in the study. Consumer Engagement (0.64, CR = 7.85, p < 0.001) has a strong effect of Visual Communication, which implies that online visuals can be used efficiently to engage users. Consumer Engagement (0.41, CR = 5.92, p < 0.001) is also strongly influenced by the Environmental Visual Cues, which supports the role of imagery with sustainability. Moreover, Consumer Engagement has a significant influence on Purchase Intention (0.61, CR = 4.97, p < 0.001), which proves this behaviour to be a key driver of behaviour. Moreover, there is a direct effect of Environmental Visual Cues on Purchase Intention (= 0.29, CR = 4.88, p) = 0.001).
Table 7
|
Table 7 Structural Path Estimate (Consumer Engagement → Purchase Intention) |
||||
|
Path |
β |
CR |
p |
R² |
|
CE → PI |
0.61 |
9.12 |
0.000 |
0.37 |
Hypothesis H3 can also be accepted whereby a significant and positive relationship between Consumer Engagement and Purchase Intention towards sustainable products was found ( 0.61, p < 0.001) and in this case, a significant portion of the variance in Purchase Intention was explained (37 percent). This can be understood as the fact that consumer engagement is a powerful behavioral motivator in the digital green marketing environments. The large standardized coefficient indicates a large practical impact which means that consumers, who actively engage in the sustainability-related digital content, are more likely to form positive purchase intentions regarding eco-friendly products.
The criticality of this relationship is that it requires interactive marketing programs like social media engagement, content sharing, and involvement of users in influencing sustainable consumption behavior. Table 7 shows the explanatory power of the model with Consumer Engagement explaining Purchase Intention variance in 37 percent (R 2 = 0.37). This suggests average predictive power, which confirms that engagement is one of the determinant factors of sustainable purchasing behavior in digital green marketing situations.
Table 8
|
Table 8 Model Fit Indices |
||
|
Fit Index |
Recommended Value |
Obtained Value |
|
χ² / df |
< 3.00 |
2.18 |
|
GFI |
> 0.90 |
0.93 |
|
AGFI |
> 0.90 |
0.92 |
|
CFI |
> 0.90 |
0.96 |
|
TLI |
> 0.90 |
0.95 |
|
RMSEA |
< 0.08 |
0.046 |
Table 8 presents some evidence of the goodness-of-fit indices that the proposed measurement and structural model of visual communication in digital green marketing fits the observed data excellently. The chi-square/degrees of freedom ratio (2.18) reveals that the model is parsimonious enough because it is way less than the recommended chi-square/degrees of freedom (3.00). The absolute fit criteria, including Goodness of Fit Index (GFI = 0.93) and Adjusted Goodness of Fit Index (AGFI = 0.91) can be used to demonstrate that the model is reflective of the sample covariance matrix and the empirical results are well aligned with the theoretical framework.
Moreover, the incremental fit indices such as Comparative Fit Index (CFI = 0.96) and Tucker-Lewis Index (TLI = 0.95) are much higher than the recommended ones, and they suggest that the proposed model is much better than the null model. The closeness of model fit and the small residual error is indicated by the Root Mean Square Error of Approximation = 0.046. Taken together, these indices prove that the model is statistically sound and can be subjected to analysis by Structural Equation Modeling (SEM). Thus, it can be said that the tested relationships are valid and can be tested using the validated model to test the hypothesized relationships between visual communication, consumer engagement and purchase intention.
Table 9
|
Table 9 Mediation Analysis (Bootstrapping Results) |
|||||
|
Path |
Direct Effect |
Indirect Effect |
Total Effect |
p-value |
Result |
|
VC → PI |
0.25 |
0.39 |
0.64 |
0.000 |
Partial Mediation |
The mediating influence between visual communication and purchase intention is a lot through consumer engagement. The indirect effect (0.39, p < 0.001) is to verify that the visual communication improves the purchase intention when it increases the engagement. Direct effect (= 0.25, p < 0.001) also is significant, which means that it is partially mediated. This implies that the visual communication has a direct and indirect impact on purchase intention through consumer engagement. Therefore, H5 is supported.
Table 10
|
Table 10 Hypothesis Testing Results |
||
|
Hypothesis |
Relationship |
Result |
|
H1 |
VC → CE |
Supported |
|
H2 |
EVC → CE |
Supported |
|
H3 |
CE → PI |
Supported |
|
H4 |
EVC → PI |
Supported |
|
H5 |
VC → CE → PI (Mediation) |
Supported |
4. Policy Recommendations
4.1. Integration of Digital Green Marketing Strategies within Corporate Sustainability Policies
Visual communication is an aspect that should be incorporated in the sustainability and ESG models of organizations. Consumer awareness and green products can be increased by the use of visually appealing digital materials like infographics, eco-labels, and sustainability storytelling to a great extent.
4.2. Environmental Visual Communication Standardization
Since environmental visual signals can greatly affect the behavior of consumers, the policymakers and industry organizations ought to establish standardized eco-labeling measures and visual sustainability rules. This will enhance transparency, minimise greenwashing and increase customer confidence in eco-friendly products.
4.3. The Clinic ought to improve the way consumers engage with the clinic via interactive digital platforms
Companies are to pay attention to the elaboration of participative and interactive digital marketing campaigns, such as social media and user-generated content and immersive visual experiences. Additional interaction will build up emotional relations with consumers and facilitate sustainable consumption behavior.
5. Conclusion
The current research has presented good empirical data to prove that visual communication plays a strategic role in digital green marketing in the process of consumer engagement and sustainable purchase intention in urban consumers. The results indicate a substantial effect of visual communication on consumer engagement (= 0.64, p < 0.001), and consumer engagement on purchase intention (= 0.61, p < 0.001) which is a strong contribution to the proportion of variance in consumer behavior. Moreover, it was also observed that environmental visual effects had a significant effect on engagement and purchase intention, which supports environmental visual effects in sustainability communication.
The findings confirm the presented model with the help of Structural Equation Modeling (SEM) and emphasize the importance of consumer engagement as a mediating variable according to which visual communication strategies are converted into real purchasing behavior. As a management technique, the research highlights the importance of investing in digitally rich, clear, and interactive information to be displayed by organizations that look appealing to potential customers in order to sell the green products. In policy terms, the results indicate that there is a need to establish institutional structures to control and standardize digital green marketing processes in the fast-moving urban markets.
5.1. Future Scope of the Study
The study has limitations, even though it has made some contributions. First, cross-sectional research design limits making long-term causal relationships of variables. Since digital green marketing impacts consumer behavior with time, future research can consider longitudinal designs to gain a more in-depth insight into the digital green marketing issue. Second, the research is narrowed down to urbanized consumers in Bangalore that could limit the applicability of the results. To increase the study to other regions or countries would increase the external validity.
Third, self-reported data can also cause some bias in responses. The future studies can be enhanced with the behavioral information or the experimental approach to confirm the results. Besides, moderating and mediating variables (environmental awareness, digital literacy, trust in green brands, and cultural factors) can be investigated in future studies to acquire a more profound understanding of the consumer behavior. The combination of the most recent methods like multi-group SEM and analytics based on artificial intelligence can also strengthen the strength and relevance of future research in the area of digital green marketing.
CONFLICT OF INTERESTS
None.
ACKNOWLEDGMENTS
None.
REFERENCES
Lim, W. M.
(2018). Demystifying neuromarketing. Journal of
Business Research, 91, 205–220.
Ottman, J. A.
(2017). The new rules of green marketing (2nd ed.). Routledge.
|
|
 This work is licensed under a: Creative Commons Attribution 4.0 International License
© ShodhKosh 2026. All Rights Reserved.