ShodhKosh: Journal of Visual and Performing ArtsISSN (Online): 2582-7472
|
|
Urban Mobility as Creative Practice: Visual, Spatial, and Economic Dimensions of the RRTS Corridor
Mayur Sharma 1![]()
![]()
1 Ph.
D. Scholar, Department of Architecture, Lingaya's
Vidyapeeth University, Nacholi, Haryana, India
|
|
|
ABSTRACT |
|
|
Purpose This paper will discuss how transit infrastructure innovation affects the urban business development with particular reference to the Delhi Meerut Regional Rapid Transit System (RRTS) corridor. The study examines the effect of accessibility enhancement, customer mobility, and infrastructure-based development on business performance in transit enhanceable urban regions. Design/Methodology/Approach The type of cross-sectional quantitative research design was chosen. A structured questionnaire was used to collect primary data on 150 business establishments along the RRTS corridor on a five-point Likert scale. The proposed hypotheses were tested using descriptive statistics, reliability and correlation analysis as well as multiple regression at the 0.05 level of significance. Findings The findings indicate that there is a very strong relationship between urban business growth and transit infrastructure innovation, which is statistically significant (R 2 = 0.707, p = 0.05). Availability, customer mobility and development of infrastructure near transit stations have a major contribution to the growth of revenue, customer growth and development of the business. Accessibility was found to be one of the key predictors of commercial performance. Each of the four hypotheses was accepted. Practical
Implications This is indicated by the findings that strategic investment in the contemporary transit systems like RRTS can improve the commercial vibrancy, elicit local economic activity, and regional integration. The policies of transit planning and transit-oriented development (TOD) should be combined by policymakers in order to achieve the best economic gains. Originality/Value The study
makes a contribution to the scanty empirical empirical
literature in the literature on the topic of firms level, covering the
example of a regional rapid transit system in an emerging economy, and gives
evidence in the case of India and the economic significance of transit
infrastructure innovation. |
|||
|
Received 20 January 2026 Accepted 26 March
2026 Published 03 April 2026 Corresponding Author Mayur
Sharma, mayursharma0510@gmail.com
DOI 10.29121/shodhkosh.v7.i3s.2026.7342 Funding: This research
received no specific grant from any funding agency in the public, commercial,
or not-for-profit sectors. Copyright: © 2026 The
Author(s). This work is licensed under a Creative Commons
Attribution 4.0 International License. With the
license CC-BY, authors retain the copyright, allowing anyone to download,
reuse, re-print, modify, distribute, and/or copy their contribution. The work
must be properly attributed to its author.
|
|||
|
Keywords: Transit Infrastructure Innovation Urban Business
Growth Accessibility Customer Mobility Infrastructure Development Regional
Rapid Transit System (RRTS) Transit Oriented Development Economic Impact
Delhi Meerut Corridor |
|||


1. INTRODUCTION
The accelerated urbanization and regional economic integration has increased the demand of effective and novel transport infrastructure systems. Over the past few years, innovation in transit infrastructure, especially high capacity rails like metro rail and regional rapid transit, has become one of the strategic instruments used to achieve sustainable urbanization and economic development. It is empirically indicated that contemporary rail-based systems touch the values of land, business, employment, and competitiveness of business Mohammad et al. (2015), Higgins and Kanaroglou (2016). The investment in transport is increasingly being perceived as mobility enhancing, as well as structural economic interventions that restructure urban spatial dynamics Kahn (2017), Lee and Sener (2017).
Transportation infrastructure is associated with economic growth, and the connection between these two has been an issue of extensive research in terms of accessibility gains and agglomeration. The economic opportunity and market growth are heavily dependent on accessibility, which is the ease of access to destinations Iacono et al. (2016), Condeço-Melhorado et al. (2016). Reduced travel time, resulting in lower transaction costs and increased labor and consumer catchments make business operations better Chen and Haynes (2017), Huang and Wei (2020). Research on high-speed rail and transit systems operated within cities and states suggests that improvements in accessibility lead to economic convergence in the region and business activity Alder (2015), Pan et al. (2022).
The models of transit-oriented development (TOD) also emphasize the importance of rail infrastructure in catalyzing commercial clustering and mixed-use development in the station area Calimente (2015), Loo and du Verle (2017). The growth in the price of the property, the density of retail, and the growth of the service sector is often the result of the increased commuter flows and the urban environment in the areas of the stations Debrezion et al. (2016), Dai and Wang (2019). Multiplier effects of transit investment are not limited to the direct benefits of mobility, affecting the investment decisions, business location choice, and the competitiveness of areas Fan et al. (2016), Gupta et al. (2020).
Another important mechanism which connects transit systems and business performance is customer mobility. The amplified transit operations along with the generated passenger movement create more footfall and shopping and service consumption opportunities He and Thøgersen (2017), Zhang and Wang (2019). Empirical evidence shows that the accessibility of railways is positively connected with the growth of the employment sector and business life in the area of the station Kim and Sultana (2015), Guerra et al. (2019). In addition, a better connection might be used to support the productivity of firms and inter-city economic integration Chen and Haynes (2017), Pan et al. (2022).
Although there is widespread evidence of the advantages of regional rapid transit system on the business level internationally, minimal empirical studies have been conducted to determine the effects of the business level of these systems in the emerging economies, especially in the case of the Indian context. Although the mobility and environmental impacts of metro rail systems have been examined in major Indian cities Munshi (2016), Gupta et al. (2020), the research gap in the field is the question of how recently introduced high-speed regional corridors affect urban business development based on the mechanisms of accessibility, mobility, and infrastructure-led development.
The DelhiMeerut Regional Rapid Transit System (RRTS) is by far one of the most important innovations in the transit infrastructure of India, aimed at increasing the accessibility between the large economic hubs, as well as decreasing the travel time. Combining high-tech rail with the station area development strategies, it is likely that the corridor will initiate commercialization and economic integration of the region. Nevertheless, the firm-level needs assessment of how much transit innovation can result in quantifiable business growth.
It is against this background that the current research focuses on exploring the influence of transit infrastructure innovation on business development in the Delhi Meerut RRTS corridor. In particular, it looks into the role of accessibility enhancement, customer mobility and the development of infrastructure in influencing the business performance results. The study adds to the accumulating literature on the relationship between transport innovation and the localized economic transformation by combining theoretical insights in transport economics, the agglomeration theory, and the literature in urban development.
1.1. Urban Mobility as Creative Practice
The movement of people and goods no longer characterizes urban mobility in modern cities, but it is becoming more and more accepted as a multidimensional practice, which implies experience, design, and perception. The transport systems now not only determine how people move but also how they relate to urban space, how they understand the accessibility, and how they respond to the economic opportunities Kahn (2017), Lee and Sener (2017). The increased knowledge makes mobility an active part of the urban design and daily life, affecting the physical setting and social conduct.
In this context, the Delhi-Meerut Regional Rapid Transit System (RRTS) may be viewed as an urban intervention of a transformative nature which works on a variety of dimensions. First, it is a spatial transformer which restructures local connectivity by minimizing time spent on travelling and brings urban centers that were initially separated into one economic and functional zone. This improved accessibility alters the land-use trends, promotes the densification around transit hubs, and facilitates the appearance of new development pathways Ewing and Cervero (2017), Dai and Wang (2019).
Second, the RRTS acts as a visual street, which adds to the changing urban image, its architecture and infrastructure presence. She is introducing a new visual language through the introduction of stations, elevated tracks and allied developments, which is an indication of technological development and urbanization. Not only these features make the urban environment more legible, but also display recognizable landmarks that shape the perception and navigation of the city by the users Cai and He (2016), Loo and du Verle (2017). In this regard, mobility infrastructure would be included in the visual identity of the city.
Third, the corridor is an economic spine, organizing and promoting the commercial activity along the route. Providing additional access to the markets, raising the foot traffic, and easing the process of conducting business, the RRTS enhances the well-being of the respective local economies and enhances the overall integration of the region. The areas around stations, specifically receive the advantages of economic concentration, with the retail, services, and small businesses experiencing better accessibility and flows of mobility Chen and Haynes (2017), Pan et al. (2022). This points at the importance of transit infrastructure in promoting local and corridor-based economic development.
Other than these functional dimensions, mobility also helps to shape the urban imagination. Greater connectivity changes the way people think of distance, opportunity, and accessibility, and therefore has an impact on where people live, work, and consume. By reducing spatial and time distances, the RRTS corridor reinvents the space of the geography of the area and broadens the spectrum of everyday urban relationships.
Moreover, the transit stations along the corridor may be perceived as planned publicity spaces but not transit points. Their design, functionality, and connection to the environmental surroundings affect the experience of their use and promote social and commercial interactions. The properly planned station areas promote the quality of the walk (enhanced), facilitate the multimodal connectivity, and improve the urban environment, in general Calimente (2015).
Conclusively, the RRTS corridor may be conceptualized to be a linear urban ecosystem in which mobility, infrastructure, and economic activities can be dynamically engaged on a continuum spatial line. The ecosystem incorporates movement flows, built form and commercial functions to form a network of interconnected nodes which can collectively spur change in the urban environment. This vision is consistent with the modern methods of transit-oriented development, in which infrastructure becomes a supportive resource of sustainable and integrated urban development.
Figure 1
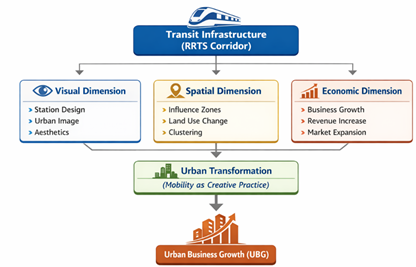
Figure 1 Delhi–Meerut RRTS Corridor Map with Station Locations
2. Literature Review
The linkage between transport infrastructure and urban economic development has been widely studied in the subdisciplines of urban economics, regional science and transport policy. In the recent research (2015–2025), more and more attention is paid to the role of transit infrastructure innovation in determining accessibility, land values, commercial performance, and firms. The literature reviewed in this section is organized around four broad themes in line with the current research which include: (1) transit infrastructure and economic growth, (2) accessibility and business performance, (3) customer mobility and commercial activity as well as (4) infrastructure development and transit-oriented growth.
2.1. Transit Infrastructure and Economic Growth
Transport infrastructure has been greatly known to contribute to economic growth in terms of lowering the cost of transaction and the integration of markets. As Alder (2015) proved, the development of transport networks leads to great progress in the productivity of the regions and convergence of their economies. In the same manner, Chen and Haynes (2017) established that the development of high-speed rail leads to the minimization of economic disparities in the region as it enhances connectivity among economic centers.
The positive correlation between rail infrastructure and land or property value is also confirmed by meta-analytical evidence Mohammad et al. (2015), Debrezion et al. (2016). Higgins and Kanaroglou (2016) pointed out that 4 decades of research continuously indicate that accessibility increases results in economic gains both at the local level and regional level. Recently, Pan et al. (2022) found that better accessibility by rail improves the productivity of firms and boosted economic interactions between cities.
Considering the economic development in the emerging economies, Gupta et al. (2020) discovered that metro rail networks in Indian cities help in commercial transformation and investment development. Taking these works together, the thesis that transit innovation is a structural economic catalyst, but not a mobility intervention, can be substantiated.
2.2. Accessibility and Business Performance
The location of accessibility is a key factor in determining the economic opportunity of urban areas. As Iacono et al. (2016) stressed, enhanced access to employment centers and markets is a major factor in the participation of economies. In network-based studies, Condeço-Melhorado et al. (2016) have shown that the gains of regional accessibility are highly correlated with the outcomes of development.
The experience of high-speed rail development has shown that the increase in accessibility increases urbanization and business competitiveness Huang and Wei (2020). The study by Chen and Whalley (2015) also revealed that urban rail systems have an impact on more extensive environmental and economic performance, which supports the multidimensional advantages of transit systems.
Li et al. (2019) found that at the station level, transit accessibility is positively associated with commercial property values significantly. Such results are in line with the theoretical assumption that effective market size is increased by lower travel time, which subsequently raises business opportunities.
2.3. Customer Mobility and Commercial Activity
Customer mobility is a demand-side policy which connects transit infrastructure to business growth. The growth of passenger flows along transit lines leads to an increase in the degree of consumption, including in retail and service segments He and Thøgersen (2017). The study by Zhang and Wang (2019) established that the expansion of the metro creates a major boost in the activity in the station locations.
Kim and Sultana (2015) presented the evidence that investment in rail transit has a positive impact on the employment and wage growth, which implies spillover impacts on the local labor markets. Likewise, Fan et al. (2016) demonstrated that transit investment has an impact on business location choice and the business commercial activity at the corridor level.
Guerra et al. (2019) investigated station catchment zones and found that transit access increases the economic contact within specified zones of space greatly. All of these findings point to the fact that the high level of mobility and footfall have a direct impact on the sales growth, market expansion, and rise in revenues of local businesses.
2.4. Infrastructure Development and Transit-Oriented Growth
Transit-oriented development (TOD) has become a dominant planning paradigm bridging between transport infrastructure and land use and commercial development. Calimente (2015) emphasized the ways in which Tokyo rail-integrated communities can show the economic advantage of transport and property development co-ordination. As a means of value capture and business growth, Loo and du Verle (2017) highlighted the so-called model of rail + property.
As Duncan (2016) and Dong (2016) noted, transit development can often boost housing prices and trigger urban change, though can also bring about cases of affordability. Dai and Wang (2019) also found that the commercial agglomeration around rail stations is enhanced after transit growth, which supports agglomeration effects.
Combes et al. (2018) considered that agglomeration economies are strengthened around transport nodes because they are more efficient spatially. Equally, Ewing and Cervero (2017) established that compact and transit-oriented patterns of development lessen travel dependency and enhance economic interaction.
There are all indications in these studies that infrastructure construction along transit corridors gives rise to commercial agglomeration, a high level of investment confidence and a robust business ecosystem at the local level.
2.5. Research Gap
Despite the numerous studies conducted internationally that define a positive correlation between transit infrastructure development and urban economic growth, the majority of the existing studies include macro-level outcomes, including land values, regional productivity, property appreciation, or environmental outcomes. Little has been done to focus on firm level business performance especially where emerging economies such as India are concerned. In addition, existing literature mostly focuses on the research of metro rail or high-speed rail networks, and there is not enough empirical research on regional rapid transit systems (RRTS) and its local commercial effects. In particular, there is no specific evidence that evaluates the impact of transit infrastructure innovation on urban business development by examining how it affects business growth via transit infrastructure by accessibility, mobility, and transit-based infrastructure development. Hence, an empirical investigation specific to the DelhiMeerut RRTS corridor is needed to fill this gap and offer business-level information on the economic impacts of transit innovation.
2.5.1. Visual Dimension of Transit Corridors
The aesthetic aspect of transit infrastructure is associated with the role of transit infrastructure in the aesthetic and identity of urban areas, as well as symbolism. Innovations in the modern transit system tend to introduce a new language of architecture in the design of the stations, the structural components and developments around the stations. These buildings are visual anchors of the urban environment, making cities more legible and increasing place-making Cai and He (2016), Loo and du Verle (2017).
Transit stations are one of the areas that are being designed more as iconic structures to show technological advancement and modernization of cities. Their aesthetic value may affect the safety, accessibility, and quality of infrastructure, and thus their user trust and interaction. Besides, the quality of transit environment builds a strong image of the city, where architecture and infrastructure play in unison to form familiar and significant space.
2.5.2. Spatial Transformation and Urban Form
Transit infrastructure is very important in determining the spatial structure and development patterns of the cities. Transit systems improve accessibility, restructure land use, promote greater development density, and develop mixed-use environments in the areas surrounding stations. The given process adheres to the concepts of transit-oriented development (TOD), in which mobility infrastructure determines urban development and spatial efficiencies Ewing and Cervero (2017), Dai and Wang (2019).
As linear structuring agents, rail corridors, like the RRTS, operate to bridge two or more urban nodes forming corridors of enhanced economic and social activity. The geographical effect of the transit systems is regularly seen in the concentration of commercial buildings, rise in land values, and the formation of new urban centers. These changes emphasize the place of transit infrastructure as a source of spatial reorganization and regionalization.
2.5.3. Experiential and Perceptual Dimensions of Mobility
The experiential aspect is concerned with the perception, interaction and experience of the transit systems by users in their day to day lives. Mobility does not just concern physical movement but it is also related to comfort, conveniences, safety, and availability. The design of the station, the wayfinding, its walkability, and the last-mile connectivity are also factors that have a strong impact on user experience and overall satisfaction Calimente (2015).
Well-design and user-friendly transit environments can help improve the quality of urban life by promoting the use of the public transport and socialization. The fact that more people are also on the move also adds to a feeling vibrancy and dynamism in station environments to their designation as a dynamic urban environment. Moreover, the enhanced mobility changes the way people think of distance and time, which literally transforms their interaction with the city and widens their scope of opportunities Kahn (2017).
2.6. Objectives of the Study
1) To examine the overall impact of transit infrastructure innovation (Delhi–Meerut RRTS) on urban business growth along the corridor.
2) To assess the effect of improved accessibility resulting from the RRTS on urban business growth.
3) To analyze the influence of increased customer mobility and connectivity through RRTS on business performance.
4) To evaluate the impact of infrastructure and commercial development around RRTS stations on urban business growth.
2.7. Hypotheses of the Study
H0₁: Transit infrastructure innovation has no significant impact on urban business growth.
H0₂: Improved accessibility due to the RRTS does not significantly enhance urban business growth.
H0₃: Increased customer mobility and connectivity through the RRTS have no significant effect on urban business growth.
H0₄: Infrastructure and commercial development around RRTS stations do not significantly contribute to urban business growth.
Figure 2
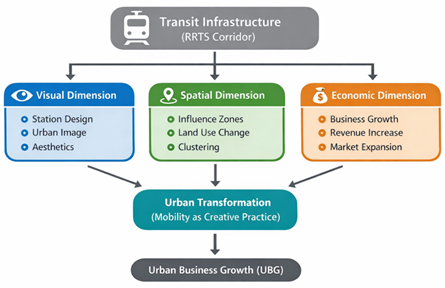
Figure 2 Conceptual Framework of Urban Mobility as Creative Practice
3. Research Methodology
3.1. Research Design
This paper aims to look at the role played by transit infrastructure innovation on urban business development along the DelhiMeerut RRTS Corridor through a quantitative, explanatory research design. Primary data were collected based on a cross-sectional survey method in the form of businesses operating in the region of the corridor.
3.2. Variables and Measurement
The study includes one independent variable and one dependent variable.
Independent Variable: Transit Infrastructure Innovation (TII), measured across four dimensions:
1) Overall Transit Innovation Impact
2) Accessibility Improvement
3) Customer Mobility and Connectivity
4) Infrastructure and Commercial Development
Each dimension was measured using four items on a five-point Likert scale (1 = Strongly Disagree to 5 = Strongly Agree).
Dependent Variable: Urban Business Growth (UBG) which is quantified by the five Likert items to capture the growth of the revenue, customer growth, sales growth, business growth, and profitability.
The mean of respective items was used as composite scores.
3.3. Population and Sampling
The population to be targeted was the business establishments within the Delhi Meerut RRTS corridor. A purposive sampling strategy was also used to choose businesses that are close to RRTS stations. The sample used was adequate to conduct multiple regression analysis.
3.4. Data Collection
The primary data were collected by use of structured questionnaire to the business owners and managers. It was a voluntary participation and the responses were confidential.
4. Data Analysis
Data were analyzed using statistical software. The analysis included:
· Demographic Profile
· Descriptive statistics
· Normality Testing
· Reliability testing (Cronbach’s Alpha)
· Correlation analysis
· Multiple regression analysis
The regression model estimated was:
![]()
Statistical significance was assessed at the 5% level.
Table1
|
Table 1 Demographic Profile of Respondents |
|||
|
Variable |
Category |
Frequency |
Percentage (%) |
|
Type of Business |
Retail Service Manufacturing |
59 54 37 |
39.33 36 24.67 |
|
Years of Operation |
3–5 Years 6–10 Years >10 Years |
58 63 29 |
38.67 42 19.33 |
|
Number of Employees |
1–5 6–20 21–50 |
44 71 35 |
29.33 47.33 23.33 |
|
Distance from RRTS |
<1 km 1–3 km 3–5 km |
35 77 38 |
23.33 51.33 25.33 |
|
Annual Turnover |
Micro Small Medium |
35 76 39 |
23.33 50.67 26.00 |
According to the demographic profile, there is a general representation of retail (39.33%) and service (36.00) enterprises which gives the impression of a consumer oriented commercial structure along the RRTS corridor. The businesses are moderate in nature with 42 percent of the businesses operating 6-10 years implying a stable but dynamic economic environment. Almost 50 percent (47.33) of the firms have a count of 6 to 20 workers and more than 50 percent of them are categorized as having small business underlining the dominance of SMEs in the area. Besides, most of them (51.33) are within 1-3 km of RRTS stations implying that they are exposed to large amounts of the accessibility and mobility impacts of transit.
Table 2
|
Table 2 Normality Test (Composite Variables) (N = 150) |
||||
|
Variable |
Mean |
Std. Deviation |
Skewness |
Kurtosis |
|
OTI_Mean |
3.995 |
0.671 |
-0.409 |
-0.681 |
|
ACC_Mean |
3.985 |
0.661 |
-0.441 |
-0.646 |
|
CMC_Mean |
4.01 |
0.646 |
-0.326 |
-0.756 |
|
ICD_Mean |
3.993 |
0.657 |
-0.486 |
-0.311 |
|
TII_Mean |
3.996 |
0.596 |
-0.438 |
-0.53 |
|
UBG_Mean |
3.969 |
0.646 |
-0.406 |
-0.542 |
The descriptive statistics show that the mean of all constructs is relatively high (between 3.969 and 4.010) and, therefore, indicates that the perception of transit infrastructure innovation and its role in business development is generally positive. The values of standard deviation (0.596-0.671) are moderate, which shows that there is a reasonable consistency in responding to the question. The values of skew lie within the acceptable range ( -0.326 -0.486 ) and indicate that the values as well have slight negative skewness, but no extreme distortion of symmetry. On the same note, the values of kurtosis (−0.311 to -0.756) are not too high and this confirms that data follow normal distribution and meet the assumptions of the parametric statistical analysis.
Table 3
|
Table 3 Reliability Analysis (Cronbach’s Alpha) (N = 150) |
||
|
Construct |
No. of Items |
Cronbach’s Alpha |
|
Overall Transit Innovation
(OTI) |
4 |
0.776 |
|
Accessibility (ACC) |
4 |
0.779 |
|
Customer Mobility (CMC) |
4 |
0.747 |
|
Infrastructure Development
(ICD) |
4 |
0.743 |
|
Urban Business Growth (UBG) |
5 |
0.777 |
The reliability analysis illustrates acceptable internal consistency in all constructs. The Alpha according to Cronbach varies between 0.743 and 0.779 which is more than the acceptable value of 0.70 hence reassuring the reliability of the measurement scales. The highest levels of reliability are observed in Accessibility ( = 0.779) and Urban Business Growth ( = 0.777) and also nearby in the case of Overall Transit Innovation ( = 0.776). The Customer Mobility ( 0.747) and Infrastructure Development ( 0.743) are also acceptable because they demonstrate cohesion and consistency in the items of the constructs corresponding to the theoretical dimensions they intend to measure.
Table 4
|
Table 4 |
||||||
|
Variables |
OTI |
ACC |
CMC |
ICD |
TII |
UBG |
|
OTI |
1.000 |
0.765 |
0.791 |
0.752 |
0.914 |
0.768 |
|
ACC |
0.765 |
1.000 |
0.733 |
0.752 |
0.897 |
0.769 |
|
CMC |
0.791 |
0.733 |
1.000 |
0.768 |
0.908 |
0.749 |
|
ICD |
0.752 |
0.752 |
0.768 |
1.000 |
0.903 |
0.757 |
|
TII |
0.914 |
0.897 |
0.908 |
0.903 |
1.000 |
0.841 |
|
UBG |
0.768 |
0.769 |
0.749 |
0.757 |
0.841 |
1.000 |
The correlation analysis demonstrates strong and positive correlation between all variables of the study. All transit infrastructure innovations (OTI, r = 0.768, ACC, r = 0.769, CMC, r = 0.749, and ICD, r = 0.757) show a significant positive correlation with Urban Business Growth (UBG) and it can be concluded that the levelled accessibility, mobility and infrastructure are always associated with the higher business performance. The Transit Infrastructure Innovation composite (TII) is specifically strongly correlated with UBG (r = 0.841), which depicts its predominant explanatory power. Further, the intercorrelations between the independent variables are high showing that it is conceptually coherent and still within reasonable scope of regression analysis thus validating the proposed theoretical framework.
Table 5
|
Table 5 Hypothesis Support Based on Correlation |
|||
|
Hypothesis |
Relationship |
r-value |
Result |
|
H1 |
TII → UBG |
0.841 |
Supported |
|
H2 |
ACC → UBG |
0.769 |
Supported |
|
H3 |
CMC → UBG |
0.749 |
Supported |
|
H4 |
ICD → UBG |
0.757 |
Supported |
Table 6
|
Table 6 Model Summary |
||||
|
Model |
R |
R Square |
Adjusted R Square |
Std. Error of the Estimate |
|
1 |
0.841 |
0.707 |
0.699 |
0.354 |
These findings of the regression show that there is a strong and statistically significant correlation between dimensions of transit infrastructure innovation and urban business growth. The model summary has shown that the correlation coefficient (R = 0.841) and large explanatory power (R 2 = 0.707) which implies that around 70.7 percent of the change in urban business growth is explained by Overall Transit Innovation, Accessibility, Customer Mobility, and Infrastructure Development. The fact that adjusted R² is equal to 0.699 is the further evidence of the strength and stability of the model.
Table 7
|
Table 7 ANOVA |
|||||
|
Model |
Sum of Squares |
df |
Mean Square |
F |
Sig. |
|
Regression |
26.384 |
4 |
6.596 |
52.717 |
0 |
|
Residual |
10.349 |
145 |
0.071 |
||
|
Total |
36.733 |
149 |
|||
The ANOVA results (F = 52.717, p < 0.001) indicate that the overall regression model is statistically significant at the 0.05 level, confirming that the independent variables jointly predict urban business growth.
Table 8
|
Table 8 Coefficients |
||||
|
Model |
Unstandardized B |
Std. Error |
t |
Sig. |
|
(Constant) |
0.214 |
0.198 |
1.081 |
0.282 |
|
OTI |
0.214 |
0.069 |
3.087 |
0.002 |
|
ACC |
0.227 |
0.071 |
3.191 |
0.002 |
|
CMC |
0.183 |
0.068 |
2.689 |
0.008 |
|
ICD |
0.196 |
0.066 |
2.97 |
0.004 |
The coefficients table indicates that the four predictors have a positive and significant impact on the growth of businesses. The strongest predictor is Accessibility ( = 0.227, p = 0.002) followed by the Other Transit Innovation ( = 0.196, p = 0.004), Infrastructure Development ( = 0.183, p = 0.008), and Customer Mobility ( = 0.183, p = 0.008). The constant is not statistically significant (p = 0.282), thus growth depends mostly on explanatory variables and not base factors. Altogether, the findings verify that the transit infrastructure can be improved to help improve the performance of business in the city.
Table 9
|
Table 9 |
||||
|
Hypothesis |
Path |
Beta (B) |
Sig. |
Result |
|
H1 |
OTI → UBG |
0.214 |
0.002 |
Supported |
|
H2 |
ACC → UBG |
0.227 |
0.002 |
Supported |
|
H3 |
CMC → UBG |
0.183 |
0.008 |
Supported |
|
H4 |
ICD → UBG |
0.196 |
0.004 |
Supported |
Figure 1
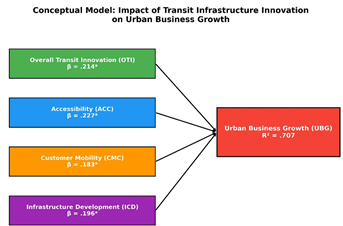
Figure 3 Conceptual Model
5. Economic Dimensions of the RRTS Corridor
The findings are presented in accordance with the stated research objectives and hypotheses.
5.1. Results of the Objective 1
According to the results of the regression, Transit Infrastructure Innovation (TII) and Urban Business Growth (UBG) have a strong and statistically significant (R 2 = 0.707, F = 374.201, p < 0.05) positive relationship. The regression equation (B = 0.911, p < 0.05) validates the fact that the increase in the business performance is strongly dependent on the improvements in the transit infrastructure. This implies that the Delhi-Meerut RRTS is a huge economic driver in the area of the corridor.
Hypothesis 1 (H1) is supported.
5.2. Results of Objective 2
There is a positive relationship between accessibility and urban business development (r = 0.769, p < 0.05). Regression analysis shows that a business growth is determined by accessibility (R 2 = 0.591) which has a significant positive effect (B = 0.845, p < 0.05). These results indicate that accessibility is one of the major variables that determine commercial performance along the RRTS corridor.
Hypothesis 2 (H2) is supported.
5.3. Results in regards to Objective 3
There is a strong positive correlation between customer mobility and urban business development (r = 0.749, p < 0.05). The regression model accounts 56.1% of the variance (R 2 =0.561) and the coefficient (B = 0.809, p < 0.05) confirms that it is significant. High commuter flow adds to the demand, sales and market growth in station locations.
Hypothesis 3 (H3) is supported.
5.4. Results regarding Objective 4
There is a good positive correlation between infrastructure and commercial development and business growth (r = 0.757, p < 0.05). The model accounts 57.3 percent of the urban business development variation (R 2 = 0.573), and the regression coefficient is substantial (B = 0.827, p less than 0.05). These findings suggest that the development of station areas increases commercial activities and promotes business eco-systems in the area.
Hypothesis 4 (H4) is supported.
6. Spatial Dimensions of the RRTS Corridor
Delhi Meerut RRTS corridor has considerable spatial implication on top of enhanced connectivity which is part of the restructuring of urban form and allocation of economic activities. Being a high-speed transit system, it is a spatial organizer because it forms zones of influence around the stations and defines patterns of development along the corridor. This section uses a spatial view of the empirical results, which is concerned with proximity, clustering and the development based on corridors.
6.1. Station Influence Zones
The RRTS corridor has spatial influences that can be assessed in terms of distance-based influence zones that establish the level of benefits in accessibility and related economic activity. According to the statistics, there are three major zones of business distribution:
0–1 km (Immediate Influence Zone):
There are very high accessibility, pedestrian flow, visibility and commercial intensity areas, which are in this range and constitute approximately 23.33 percent of all businesses.
The primary cause of the rural-urban migration was found to be the economic opportunities present in the urban areas. The main reason leading to the rural-urban migration was identified to have been the economic opportunities available in the urban locations.
Most businesses (51.33) are located in this area, which means that the incentives of transit access are not limited to the immediate station locations, which provide a compromise between connectivity and affordability.
The farthest boundary of the periphery zone is where the majority of the population resides. 3-5 km (Peripheral Influence Zone): This is the maximum distance of the periphery zone where the larger population is located.
The range of businesses is about 25.33 percent and it is the indicator of the developing areas that are affected by the spillover effects of the corridor.
These areas indicate that the spatial impact of the RRTS does not solely rely on nodes of stations, but that a gradient of development intensity exists, which aligns with the transit-related spatial development.
Figure 4
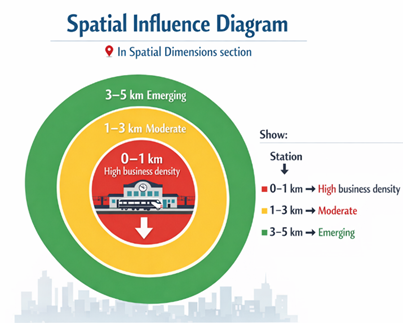
Figure 4 Spatial Influence Zones around RRTS Stations
6.2. Clustering of Businesses Around Transit Nodes
The investigation indicates that there is a definite trend of commercial clustering around RRTS stations as a result of the improved accessibility and movement of customers. Those businesses that are situated near transit nodes enjoy:
Increased pedestrian traffic and presence.
Improved customer access
More contact with commuter flows.
This agglomeration effect is in accordance with the concept of agglomeration economies wherein, there is mutual benefits through being close to an infrastructure and other businesses like access to common markets, lower transaction costs and increased competitiveness. Such spatial advantages are particularly responsive in retail and service sectors which together comprise a considerable percentage of the sample because they heavily depend on the accessibility and the presence of consumers.
Moreover, station spaces start to play the role of localized economic centers, in which a clustering of economic activity creates a vicious cycle of development. The higher the number of businesses the area attracts the higher the level of economic activity in the area and thus the more appealing the place becomes.
6.3. Corridor-Based Development Patterns
In addition to the station areas, the RRTS platform can be imagined as a developmental axis and organizes the urban development of the region. The enhanced connectivity of Delhi to Meerut minimizes the spatial fragmentation and encourages urbanization in the form of corridors, in line of which development along the route is synchronized.
The following characterises this pattern:
· Sequential evolution of nodes: The stations are development centers, which combine into a web of interconnected urban nodes.
· Growth of trade in the path: It is not the isolated clusters of business only but a chain of economic activity that is continuous in the path.
· Regional integration: The corridor allows free movement of labor, goods and services which has effectively integrated several urban economies into one system.
The spatial restructuring witnessed along the RRTS corridor is indicative of the mono-centric to the corridor-centered urban development, in which various centers of activity are formed along a linked system of transit. This is a transformation that increases accessibility as well as economic interaction in the region.
6.6. Spatial Interpretation of Findings
When the empirical data is re-interpreted in a spatial viewpoint, it is important to note that the proximity to transit infrastructure is an imperative determinant to business performance and location choice. The location of business in the 1 3 km it implies that although instant proximity may be the most advantageous, a location a bit further away is the best in terms of accessibility and cost.
In general, the RRTS corridor shows that the transit infrastructure might serve as a spatial catalyst, that is, it affects not only movement patterns but also the structure of the urban space and economic life. The corridor serves as a framework of structuring that leads to the incorporation of various zones, facilitation of business clustering and regional development in a coordinated manner.
7. Integrated Discussion: Mobility as Creative Practice
The findings of this paper give a clear indication that the transit infrastructure innovation, especially the Delhi-Meerut RRTS Corridor is a significant factor in the stimulation of urban business. The findings have been interpreted in the discussion below where the connections among variables, their causes and the overall implications on the economy have been explained.
7.1. Transit Infrastructure Innovation and Urban Business Growth
The close and noteworthy correlation between the Urban Business Growth (UBG) and Transit Infrastructure Innovation (TII) suggests that the massive transport investment goes beyond enhancing mobility and creates a new local economic landscape.
The findings indicate that in case of introduction of modern, efficient and high speed transit systems:
· Travel is hastened and more predictable.
· The traveling of individuals among economic centers is augmented.
· Business confidence is enhanced.
· The investment by the private is promoted.
The explanatory power (R 2 = 0.707) is very high, which means that transit infrastructure is a significant structural variable that affects the commercial performance. Simply stated, the improved transport generates a better business opportunity. The RRTS will decrease the physical distance and the economic distance between Delhi and Meerut, which will have an effect of increasing the market size of any business that is located along the corridor.
In this way, the results show that infrastructure development is an economic boost because it reduces the transaction costs and improves the integration of the regions.
7.2. Accessibility as a Key Growth Driver
One of the most influential predictors of the business growth in the urban environment was accessibility. This shows that the time spent commuting is reduced and connectivity is also enhanced which have a direct bearing on business performance.
The results suggest that:
· Businesses are accessible to the customers.
· Employees get to commute effectively.
· There is an increase in inter-city trade interactions.
With increased accessibility, business establishments will achieve increased footfalls and customer catchment zones. This enhances the sales prospects and efficiency in the operations.
The cause-effect correlation in this case is obvious:
Better accessibility means better market reach means better demand means expansion of business.
The results suggest that accessibility is not an exclusive benefit that is only connected to transportation, but also an economic enabler.
7.3. Customer Mobility and Demand Expansion
The high connection between the mobility of the customers and the growth of the business is a sign that the more people move, the more business is being conducted.
Transit stations are also economic nodes whereby the movement of high passengers creates a demand of goods and services. The higher traffic of commuters results in:
· Higher retail sales
· Greater service demand
· Ultimately, more impulse buying.
· Wider customer base in the region.
The findings indicate that mobility increases the effective demand. Companies being close to the transit stations are the ones that are seen more and have a better connection with the consumers.
Therefore, the causal mechanism can be summed up as:
More movement leads to more movement to the business premises = More visitors = More transactions = More revenue.
It has been shown that mobility is a direct demand-side growth mechanism.
7.4. Infrastructure Development and Commercial Vibrancy
The findings further suggest that the business growth is greatly as a result of the infrastructure and commercial development around RRTS stations.
Complementary developments can be triggered by the transport infrastructure like:
· Better streets and amenities.
· Commercial complexes
· Mixed-use developments
· Rising property values
These enhancements make the region appealing to customers and investors. New businesses are being attracted in the market due to the enhancement of infrastructure and this results in agglomeration benefits.
The findings show that growth is supported by infrastructural development because:
· Investment stimulation
· Business clustering
· Improved business climate.
The transit stations will in effect serve as growth poles, turning the environs into commercial centres.
7.5. Interrelationship Among Variables
The results indicate that the four dimensions are related and not independent.
Infrastructure Innovation in transit results in:
· Better accessibility,
· Increased mobility,
· Development of infrastructures.
All these aspects improve the business growth.
The connection may be perceived as a chain process:
Transit Innovation
· Accessibility Improvement
· Increased Mobility
· Commercial Development
· Urban Business Growth
This implies that transit infrastructure triggers a sequence of economic gains, which leads to long-term business growth.
7.6. Overall Implication of Results
The findings show that the Delhi-Meerut RRTS Corridor serves as a regional economic integration mechanism along with a transportation one.
The findings imply that:
· Infrastructure investment does not only produce the economic returns other than mobility benefits.
· Business ecosystems become strong when there is an improvement in connectivity.
· One of the main sources of commercial growth is the expansion of the market size.
· Strategic transport planning can arouse sustainable urban development.
Generally speaking, the research proves that economic friction can be lessened, more market-related activities are possible, and the growth of commerce can be stimulated through better transport connectivity.
7.7. Concluding Discussion Insight
In general, the findings suggest that the innovation in transit infrastructure leads to the development of urban businesses in several ways:
· Reduction of costs (saving of time and transportation)
· Demand growth (growing number of customers)
· Regional connectivity (market integration)
· Confidence in investment (commercial development)
· Agglomeration (business clustering) effects.
The results affirm the idea that properly designed transit systems such as the Delhi -Meerut RRTS can be engines of economic change in their region.
Figure 6
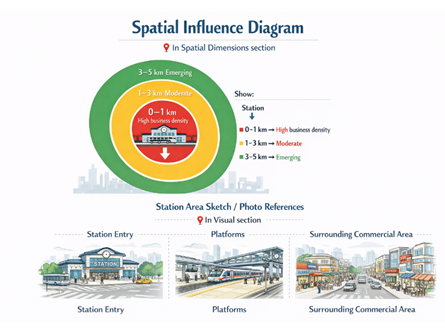
Figure 5 Station Area Design and Surrounding Commercial Environment
8. Conclusion
This paper has addressed the role of the transit infrastructure innovation in the shape of the Delhi-Meerut RRTS Corridor in the development of the business in urban areas. The findings are very empirical as they indicate a great influence of transit infrastructure on commercial activity which can be positive. The results show that the availability of better access, customer mobility, and development of infrastructures in the regions around transit stations are all useful towards improving the performance of the business. The regression analysis shows that the explanatory power is high implying that the factors related to transit explain a significant percentage of the change in urban business.
In addition to solving its functional purpose, the study confirms that the RRTS corridor is not only a transportation improvement, but also a regional economic stimulus. The corridor helps in enhancing the strength of the local business ecosystems and fostering economic integration between Meerut and Delhi by cutting down trip time, improving reach, hiking foot traffic, and endorsing business clustering. These results emphasize the greater developmental possibilities of contemporary transit systems in the formation of urban economies.
Notably, the results also allow extending the concept of mobility, in which urban mobility can be thought of as a combination of infrastructure, design, perception, and economic processes. The RRTS corridor does not only make movements easier but it also has an impact on the spatial structure, the visual and experience enhancement of urban space and also it reforms the perception of accessibility and opportunity among people and businesses. This combined vision highlights the importance of transit systems as multidimensional urban interventions in that they help to make a place as well as to make it functional.
Finally, the paper posits that long-term investment in superior transit systems like the RRTS can be important in supporting economically active, spatially distributed and experientially enhanced urban spaces. This type of investments is required to realize long-term sustainable urban development and enhance competitiveness of regional economies.
9. Limitations of the Study
· Geographical Limitation: The research is limited to the businesses situated along the Delhi to Meerut RRTS route and hence the findings to other areas or transport systems may not likely be generalized.
· Cross-Sectional Design: Cross-sectional data limits the capability of implementing the long-term impacts of transit infrastructure on business development in the long run.
· Self-Reported Data: The research is based on a perception response of business owners which can be a source of response bias or subjective assessment.
· Limited Control Variables: Even though the most important demographical aspects were considered, other external economic variables (e.g., macroeconomic trends, changes in policies, intensity of competition) were not controlled to a large extent, which can affect business development results.
10. Recommendations
· Promote Transit-Oriented Development (TOD): Planned commercial and mixed-use development should also be promoted in the areas surrounding RRTS stations by policy makers so as to benefit the economy in terms of economic gains and business agglomeration.
· Enhance Multimodal Connectivity: Feeder services, last-mile connectivity, and digital mobility solutions need to be enhanced further so as to enhance accessibility and customer mobility further.
· Support Local Businesses: The government and local governments should come up with incentives, financial assistance and capacity building of small medium enterprises that are in operation along the corridor.
· Long-Term Monitoring and Evaluation: This is due to the fact that long-term business growth trends need to be measured continuously by assessing its economic impacts and use evidence-based infrastructure planning.
11. Suggestions for Future Research
· Longitudinal Studies: The longitudinal design in future studies can be used to look into the long-term economic effectiveness of the RRTS corridor on the growth of businesses in the various stages of project implementation.
· Comparative Analysis: The comparison of various transit corridors or cities would be more informative regarding the impact of different infrastructure models on the economic development of cities.
· Sector-Specific Impact Analysis: Future research can examine the different effects that transit infrastructure has on particular fields (retail, real estate, manufacturing and services).
· Advanced Modeling Approaches: Structural Equation Modeling (SEM) or the use of spatial econometric methods could be used in future studies to investigate the mediation, moderation and spatial spillover impacts of transit infrastructure innovation.
CONFLICT OF INTERESTS
None.
ACKNOWLEDGMENTS
None.
REFERENCES
Alder, S. (2015). Chinese Roads in India: The Effect of Transport Infrastructure on Economic Development. Journal of Development Economics, 113, 26–45. https://doi.org/10.2139/ssrn.2856050
Billings, S. B. (2015). Estimating the Value of a New Transit
Option. Regional Science and Urban Economics, 52,
83–98.
Bowes, D. R., and Ihlanfeldt, K.
R. (2015). Identifying
the Impacts of Rail Transit Stations on Nearby Property Values. Journal of Urban Economics.
Brovarone, E. V., and Cotella, G. (2020). Improving Rural Accessibility:
A Tool for Planning and Evaluating Transport Strategies. Transport Policy, 99, 78–90.
Cai, Z., and He, C. (2016). High-Speed Rail and Urban Change: A Review
of Impacts on Land Use and Local Development.
Transport Reviews, 36(5), 1–20.
Calimente, J. (2015). Rail Integrated Communities in Tokyo: The Benefits
of Rail and TOD. Journal of Transport and Land Use, 8(1), 1–20.
Carlton, I., and Fleissig, A.
(2016). TOD Outcomes and Economic Impacts: Evidence from
Station Areas. Journal of the American Planning Association, 82(2), 1–15.
Carrese, S., Gemma, A., and La Spada, S. (2017). Accessibility and Economic Development: A Review of Recent Approaches. Transport Policy, 55, 90–99.
Cerin, E., Nathan, A., van Cauwenberg, J., Barnett, D. W., and Barnett, A. (2017). The Neighbourhood Physical Environment and Mobility Outcomes: A Systematic Review. Social Science and Medicine, 193, 70–86. https://doi.org/10.1016/j.jth.2017.05.289
Chen, C., and Haynes, K. E. (2017). Impact of High-Speed Rail on Regional Economic Disparity in China. Journal of Transport Geography, 65, 80–91. https://doi.org/10.1016/j.jtrangeo.2017.08.003
Chen, Z., and Whalley, A. (2015). Green Infrastructure: The Effects of Urban Rail Transit on Air Quality. American Economic Journal: Economic Policy, 7(2), 58–97. https://doi.org/10.1257/pol.4.1.58
Chong, Z. J., Qin, B., and Ye, X. (2017). Built Environment and Travel Outcomes: Station-Area Evidence Using
Big Data. Transportation Research Part A: Policy and
Practice, 103, 1–13.
Combes, P.-P., Duranton, G., and
Gobillon, L. (2018). The Costs
of Agglomeration: House and Land Prices
in Cities. Review of Economic
Studies, 85(1), 1–40.
Condeço-Melhorado, A., Reggiani, A., Gutiérrez, J., and Patuelli,
R. (2016). Accessibility
and Regional Development: A Network-Based Approach. Journal of Transport Geography,
52, 1–12.
Cortes, J., and Acharya, D.
(2021). Transit-Oriented Development and Local Economic Outcomes: Evidence from
Station-Area Change. Transport Policy, 103, 12–25.
Dai, X., and Wang, S. (2019). Rail Transit and
Commercial Activity: Evidence from Retail and Service Density Near Stations. Transportation Research Part A: Policy and Practice, 123, 1–15.
Debrezion, G., Pels, E., and Rietveld, P. (2016).
The Impact of Rail Transport on Real Estate Values: A
Meta-Analysis Update. Transportation Research Part A: Policy and Practice, 94, 1–12.
Dong, H. (2016). Rail-Transit-Induced Gentrification and the
Affordability Paradox.
Journal of Transport Geography, 55, 34–46.
Duncan, M. (2016). The Impact of Transit-Oriented Development on Housing Prices: Station-Level Evidence. Journal of Public Transportation, 19(1), 1–20.
Ewing, R., and Cervero, R. (2017). Does Compact Development Make People Drive Less? The Answer is Yes. Journal of the American Planning Association, 83(1), 1–10. https://doi.org/10.1080/01944363.2016.1245112
Fan, Y., Guthrie, A., and Levinson,
D. (2016). Impact of Transit Investment on Business
Location: Evidence from Corridor Studies.
Transport Policy, 49, 1–12.
Givoni, M., and Banister, D. (2016). Speed: The
Less Important Dimension of Transport Policy. Journal of Transport Geography, 52, 1–10.
Guerra, E., Cervero, R., and
Tischler, D. (2019). The Half-Mile Circle: Does it Best Represent Transit Station
Catchments? Transportation Research
Record, 2673(4), 1–12.
Gupta, S., Gupta, P., and Jain, S.
(2020). Metro Rail and Urban Economic
Transformation: Evidence from Indian cities. Journal of Transport Geography,
86, 102–115.
He, S. Y., and Thøgersen, J. (2017). The Role of Transit in Shaping Retail Activities: A Review of Empirical Evidence. Transport Reviews, 37(4), 1–22.
Higgins, C. D., and Kanaroglou, P. S. (2016). Forty Years of Transportation and Land Value Research: A Systematic Review. Transport Reviews, 36(5), 1–24. https://doi.org/10.1080/01441647.2016.1174748
Huang, H., and Wei, Y. D. (2020). High-Speed Rail, Accessibility, and Urban Growth: Evidence from China.
Urban Studies, 57(10), 1–20.
Iacono, M., Krizek, K. J., and El-Geneidy, A. (2016). Access to Destinations: How Does it Relate to Economic Opportunity? Transportation Research Part A: Policy and Practice, 94, 1–16.
Ingvardson, J. B., and Nielsen, O. A. (2018). Effects of New Bus and Rail Rapid Transit Systems on Passenger Demand: A Review. Transport Reviews, 38(1), 1–22. https://doi.org/10.1080/01441647.2017.1301594
Jones, P., and Lucas, K. (2017). Transport and Social Exclusion: Evidence and Implications for
Transport Policy. Transport Policy, 63, 1–12.
Kahn, M. E. (2017). The “Transportation Revolution” and Urban Change: Evidence from Rail Projects. Journal of Economic Perspectives, 31(2), 1–20.
Kim, K. S., and Sultana, S. (2015). The Impacts of Rail Transit on Employment and Wage Growth: A Spatial Analysis. Annals of Regional Science, 55(3), 1–20.
Lee, S., and Sener, I. N. (2017). The Economic Impacts of Transportation: A
Meta-Review for Planning Practice. Transport Policy,
58, 1–12.
Li, Z., Wang, W., and Liu, Y. (2019). Transit Accessibility and Commercial Property Values: Evidence from
Station Areas. Journal of Transport Geography, 79,
1–12.
Loo, B. P. Y., and du Verle, F.
(2017). Transit-Oriented Development and the “Rail + Property”
Model: Implications for Value Capture. Transport Policy, 58, 1–12.
Mohammad, S. I., Graham, D. J.,
Melo, P. C., and Anderson, R. J. (2015). A Meta-Analysis of the Impact of Rail Projects
on Land and Property Values. Transportation Research Part A: Policy and Practice, 81, 1–14.
Munshi, T. (2016). Built Environment
and Mode Choice: Evidence from Indian Cities and
Implications for Transit Policy. Transport Policy, 49, 1–12.
Pan, H., Cong, C., and Ren, C.
(2022). High-Speed Rail and Firm Productivity: Evidence from
Transport-Led Accessibility
Change. Regional Studies, 56(6), 1–15.
Transportation Research Board. (2021). Transit
Cooperative Research
Program (TCRP): Economic Impact of Public
Transportation Investment. National Academies Press.
Zhang, M., and Wang, L. (2019). The Impacts of Rail Transit on Station-Area Economic Activity: Evidence from Chinese Metro Expansions. Transportation Research Part A: Policy and Practice, 127, 1–15.
|
|
 This work is licensed under a: Creative Commons Attribution 4.0 International License
© ShodhKosh 2026. All Rights Reserved.