ShodhKosh: Journal of Visual and Performing ArtsISSN (Online): 2582-7472
|
|
Cultural Analytics in Visual Arts: Using Data Science to Understand Aesthetic Trends
Pushpa Nagini Sripada 1![]()
![]() ,
Keerthika K. 2
,
Keerthika K. 2![]() , Aswitha V. 3
, Aswitha V. 3![]() , Mahesh Kumar PG 4
, Mahesh Kumar PG 4![]()
![]() ,
Anandhi D. 5
,
Anandhi D. 5![]()
![]() ,
E. Rajesh 6
,
E. Rajesh 6![]()
1 Professor,
Department of English, Meenakshi College of Arts and Science, Meenakshi Academy
of Higher Education and Research, India
2 Department
of Computer Science, Meenakshi College of Arts and Science, Meenakshi Academy
of Higher Education and Research, India
3 Assistant Professor,
Department of English, Meenakshi College of Arts and Science, Meenakshi Academy
of Higher Education and Research, India
4 Meenakshi College of
Physiotherapy, Meenakshi Academy of Higher Education and Research, India
5 Assistant Professor /
Research Scientist, Department of Biochemistry, Meenakshi Ammal Dental College
and Hospital, Meenakshi Academy of Higher Education and Research, India
6 Professor, Oral and
Maxillofacial Pathology and Oral Microbiology, Sree Balaji Dental College and
Hospital, Bharath Institute of Higher Education and Research (BIHER), Chennai,
Tamil Nadu, India
|
|
|
ABSTRACT |
|
|
The presence
of digital technologies and extensive digitization of collections of cultural
heritage has established new possibilities in the use of data science
approaches to the study of visual arts. Computational analysis Cultural
analytics is a field of digital humanities that integrates computational
analysis with large-scale art collections to explore aesthetic patterns. The
study analyzes the applications of machine learning, computer vision and
statistical modeling methods to detect stylistic trends and evolution of
artwork in the visual culture. Organized computational system which involves
textual data intake, pre-processing of images, elements of feature detection
and clustering algorithms alongside visualization techniques to examine
aesthetic qualities in computerized images is introduced. Analytical evidence
of representative datasets of digital art data show that quantifiable trends
exist in the diversity of color, the complexity of texture, the variability
of composition and the subject matter representation across artistic
movements. Findings indicate that there are obvious stylistic groups that can
be traced back to historical artistic movements like Renaissance, Baroque,
Impressionism and Modernism. Temporal analysis also suggests the growing
variation in styles and colors of artistic processes in modern times as
compared to prior eras. These computational findings can be interpreted with
the help of visualization techniques such as trend graphs, heatmaps and
cluster representations. The research shows cultural analytics is a useful
interdisciplinary tool to address aesthetic development in visual arts. Data
analysis is an addition to the conventional art historical interpretation
because it allows exploring visual culture on a large scale. The results
indicate that artificial intelligence and cultural data analytics have a
promising future in the development of research in digital humanities, museum
studies, and computational art history. |
|||
|
Received 24 January 2025 Accepted 28 March
2026 Published 03 April 2026 Corresponding Author Pushpa
Nagini Sripada, sripadapn@maher.ac.in DOI 10.29121/shodhkosh.v7.i3s.2026.7325 Funding: This research
received no specific grant from any funding agency in the public, commercial,
or not-for-profit sectors. Copyright: © 2026 The
Author(s). This work is licensed under a Creative Commons
Attribution 4.0 International License. With the
license CC-BY, authors retain the copyright, allowing anyone to download,
reuse, re-print, modify, distribute, and/or copy their contribution. The work
must be properly attributed to its author.
|
|||
|
Keywords: Cultural Analytics, Visual Arts Analysis, Digital
Humanities, Computer Vision in Art, Aesthetic Trend Analysis, Machine
Learning for Cultural Data, Computational Art History, Cultural Data
Visualization |
|||


1. INTRODUCTION
The digital technologies have really changed the manner in which cultural artifacts are studied, conserved and interpreted. The visual arts which have been traditionally studied by qualitative methods grounded in art history and aesthetics are also becoming open to computational methods that enable the researcher to study large-scale datasets of culture. An interdisciplinary approach to digital humanities, data science, and visual culture studies known as cultural analytics allows a researcher to identify trends in artistic creation, stylistic development, and viewership that might not be readily observed using traditional methods of research alone. The process of digitization of museum collections, online art archives, and social media has created a previously unprecedented amount of visual information that can be analyzed through machine learning, statistical models, and computer vision approaches.
Figure 1
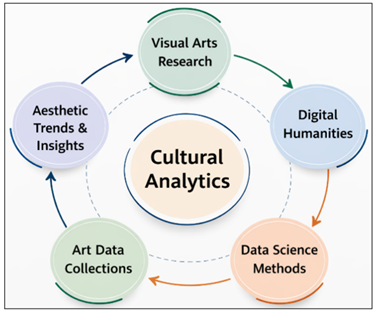
Figure 1 Interdisciplinary Framework in Visual Arts Research
Cultural analytics creates a possibility to explore the aesthetic trends of various periods of time and various geographic locations through analysis of visual attributes of color scheme, composition designs, subject matter, and stylistic attributes. These calculational understandings can be used together with conventional art historical approaches to enable researchers analyze many thousands or even millions of artworks at the same time. The use of data science methods in the visual arts allows researchers to find common stylistic trends, quantify shifts in the artistic tastes of artists and populations, and find connections between artists, art movements, and cultural backgrounds Fu et al. (2024). These are some of the ways that have been increasingly applied in the digital humanities research where quantitative analysis is used to give more meaning of cultural phenomena as illustrated in Figure 1. The cultural analytics dimension consists in the perception of the engagement of the audience with visual art in the digital era. Social media and online galleries provide useful engagement statistics such as likes, sharing, comments and viewership. The measurement of these metrics with the help of the data science tools enables the researchers to examine the development of the aesthetic preferences among the audiences and cultural trends in digital networks. These lessons can be especially useful in museums, galleries, and other cultural organizations that want to comprehend how people can engage with art Labadi et al. (2021).
2. Background: Cultural Analytics and Digital Art Studies
Cultural analytics has become an interdisciplinary field of research that integrates computational data analysis and digital humanities approaches to study cultural artifacts in large quantities. Cultural analytics in the visual arts attempts to analyze artistic trends, style changes, and aesthetic patterns quantitatively based on the methods of computer science and statistics. In conventional art historical studies, the qualitative analysis of a particular work of art, artist or movement was often done meticulously Yao et al. (2022). The step which follows feature extraction in the analytical pipeline is feature extraction. At this stage, the foundations of cultural analytics were greatly shaped by the changes in the domain of digital humanities and the growth of the digitized collections of cultural heritage. Cultural institutions and museums worldwide have engaged in large scale digitization projects that result in the 0/Free access to high-resolution images of artifacts as well as detailed descriptive metadata Shinabargar (2023). These collections contain data on artists, date of creation, style of art, materials and techniques as well as classification of the themes. This type of organized information would serve as a perfect source of computational analysis to determine the correlations among artistic features and the history of the situation.
Figure 2

Figure 2 Transition of Arts Research Methods
Visual arts studies often use the methods of machine learning, image processing, and statistical modeling in their computational approach to visual arts research. The visual attributes that can be extracted by image analysis algorithms include color distribution, texture, geometric composition, and shape. They can then be analyzed with the help of clustering algorithms to find similarities in artworks based on their style or classification models to classify artworks based on artistic movements as shown in Figure 2. As an example, the development of color palettes in a tradition of painting has been studied by computation, or stylistic change between the art movement of Impressionism and Post-Impressionism has been identified by computer. Interaction of the visual culture and the digital media platforms is also researched by digital art studies Wang (2022). Digital exhibitions, arts communities on the web and social media sharing have developed new practices of culture engagement that can produce mass quantities of information about what the audience is doing with art. It is possible to study the patterns of aesthetic preference, cultural diffusion and visual communication in online space using cultural analytics tools that can analyze these datasets. These insights broaden the art historical research beyond the conventional museum lessons and allow the scholars to explore the way in which visual culture develops in both the physical and the virtual realm Kashyap et al. (2025).
3. Data Sources for Visual Arts Analytics
The quality of the culture analytics studies, within the visual arts, is mostly based on the quality of thorough and structured datasets. There are several data sources that can be used to analyze aesthetic trends, and some of them are digitised museum collections, online art databases, digital exhibition archives, and social media platforms. All these sources offer huge sets of visual images and metadata that may be employed to examine the artistic progression in historical eras and territories. The increased move towards open-ended digital collections has greatly increased the possibilities of researchers to use computational methods in the analysis of visual arts Desikan et al. (2022). Digitized museum collections are one of the most useful sources of information to cultural analytics. Numerous mainstream museums have created web-based repositories that online expose thousands of works of art and comprehensive metadata about the artist, the date of creation, the artistic movement, medium, dimensions, and topic Howard (2022). Digital collections that are held by large museums and cultural heritage institutions are examples as outlined in Table 1. These data sets can be used to investigate long- term trends in visual art production and stylistic evolution over centuries of visual art history.
Table 1
|
Table 1 Digital Visual Art Dataset Characteristics |
||||
|
Dataset Source |
Time Period Covered |
Number of Artworks |
Metadata Attributes |
Image Resolution |
|
Museum Digital
Collection A |
1600–1900 |
2,500 |
Artist, Year, Style,
Medium |
1024×1024 |
|
Online Art Archive B |
1850–2000 |
3,200 |
Artist, Movement,
Subject |
800×800 |
|
Contemporary Art
Database C |
2000–2023 |
1,750 |
Artist, Theme, Color
Tags |
1200×1200 |
|
Social Media Art
Dataset D |
2018–2024 |
4,500 |
Likes, Shares,
Comments |
Variable |
Computational analysis can also be provided by online databases of art and digital cultural heritage. These databases tend to archive artworks of more than one institution to form repositories on large scale that can be used to compare artworks of different cultural contexts Sinclair et al. (2022). Metadata accompanying these collections can also cover thematic classifications, artistic influences, and exhibition histories and allow a researcher to examine artists and art movements in relation to each other. The other important source of information in exploring modern visual culture has proved to be the social media platforms Zhang (2022). Social applications where one can post pictures and communicate about artworks create engagement metrics, including views, likes, shares, and comments. The metrics are useful in understanding what audiences like and what cultural trends do exist in the digital age. By examining the use patterns of social media it is possible to understand the dissemination pattern of some visual styles or themes within online communities and also it is possible to understand how artists and their content are disseminated through the online community Kulikova (2021).
4. Data Science Techniques for Analyzing Aesthetic Trends
Cultural analytics relies greatly on data science methods to help scientists derive important patterns in a large body of visual art. Such approaches as image processing, machine learning, and statistical modeling enable the scholars to study the visual qualities of works of art and define the stylistic trend of various artistic movements and periods. These methods of computation complete the traditional art historical interpretation by offering quantitative information about the patterns of aesthetics that could not be observed easily using only qualitative analysis Wen and White (2020). Table 2 shows Computer vision techniques are widely utilized in analyzing visual characteristics that can be found in paintings. Algorithms of image feature extractions have the capability to detect features like color distribution, texture patterns, edges, and compositional geometry. Analysis These can include color histogram, e.g. frequency and distribution of colors of a work of art, enabling researchers to study the change in colour palette through time in art Lee et al. (2020). In the same way, when it comes to artistic techniques or style of painting, unique patterns can be detected through the use of texture analysis.
Table 2
|
Table 2 Visual Feature Extraction Parameters |
|||
|
Feature Type |
Extraction Method |
Description |
Analytical Purpose |
|
Color Histogram |
RGB Histogram Analysis |
Measures color
distribution |
Detect palette trends |
|
Texture Features |
GLCM Texture Analysis |
Captures brushstroke
texture |
Style identification |
|
Edge Features |
Canny Edge Detection |
Detects structural
composition |
Artistic composition
analysis |
|
Shape Patterns |
Contour Detection |
Identifies geometric
forms |
Style classification |
The cultural analytics has greatly relied on the machine learning algorithms to classify works of art and identify the stylistic similarity as defined in Table 2. The trained supervised learning methods can equally be used to detect the different artistic movements using a collection of labeled artworks. Once trained, these models will have the capability of identifying new artworks by style automatically. Unsupervised Clustering, also called clustering, can also be applied in the exploration of large datasets, which lack preset labels. The painting clustering algorithms cluster the paintings based on the similarity of visual attributes that may be patterns of the paintings, perhaps by movements in art or subjects Zhang et al. (2021). The statistical analysis methods can also be used to support the interpretation of aesthetic tendencies and possibly find the correlation between the artistic features and the historical factors. Some of the variables that can be analyzed using the regression analysis include the relationships of time, medium of art, and color. Temporal trend will indicate how a certain part of the visual image can emerge to be more pronounced at a certain time in history Inisatool and Phuakkhong (2025). Some of the most widely used visualization tools that help to interpret such patterns and report analytical results understandably are hat maps, network graphs, and Time series charts.
5. Computational Framework for Cultural Analytics
The initial phase of the framework is gathering both visual and metadata data of digital art collections in repositories, museum databases and image web platforms. Such datasets are also very heterogeneous in format and structure and therefore have to be preprocessed so that they become consistent and usable Lyu et al. (2023). The cleaning processes of data eliminate records of duplications, fix insufficient metadata, and uniform the formats of the attributes like artist names, creation dates, and style categories. Image preprocessing methods can also be used to normalize the size, resolution and color representation of image prior to computational analysis. computational algorithms are used to analyze every artwork image to obtain quantifiable visual features. These characteristics can be the color palette statistics, the descriptors of the texture, the geometric shapes, and the space composition patterns. A quantitative representation of visual characteristics produced in this process produces feature vectors that can be analyzed in machine learning. Dingankar et al. (2025)
Figure 3
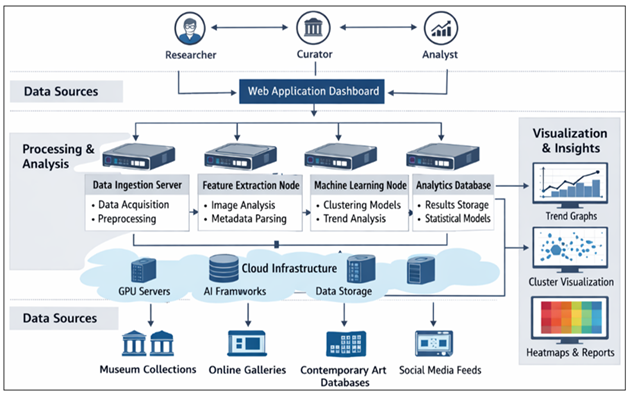
Figure 3 Digital
Cultural Data Ecosystem Supporting Visual Arts Analytics.
The stage of feature extraction is followed by modeling and analytical processing. The extracted features are processed by machine learning algorithms which detect patterns and relationships in the dataset. Classification models differentiate artworks by stylistic movement whereas clustering algorithms differentiate artworks by appearance. The temporal analysis techniques study the temporal variations of aesthetic properties, which allows researchers to trace the trends of art production and the cultural expression. The last phase of the framework is placed on data visualization and interpretation as shown in Figure 3. Graphical formulations are commonly used to display the results of analysis, e.g., trend charts, cluster maps, and network diagrams showing the relationship of artworks, artists, and styles. The visualization tools can help the researcher to interactively analyze and interpret intricate patterns in visual culture using large data sets. An efficient computational framework consequently incorporates a range of analysis elements to facilitate a holistic cultural analytics study as it applies to visual arts. Vijayakumar et al. (2026)
6. Case Study: Detecting Aesthetic Trends in Digital Art Collections
The repositories of digital art offer a perfect situation to implement the cultural analytics techniques to define aesthetic trends over time. Case study was carried out based on the curated set of digitized works of art retrieved online museum archives and digital art collections. There are paintings that represent four key movements in art in the dataset, i.e. Renaissance, Baroque, Impressionism and Modernism. Computer vision techniques were applied on each image of artwork to yield quantifiable visual descriptions of the work, like color variety, texture richness, and composition variation. These features offer quantitative measures that may track the patterns of the style in visual collections of art. The case study dataset consists of 1,200 pieces of art dating back to the sixteenth century to the end of the twentieth century. Each piece of art is linked to such metadata as the name of the artist, year of production, movement, and theme. Extracting image features methods were used to determine normalized measures of visual attributes. Clustering and statistical trend analysis were then used to analyze these features to find out the differences between artistic movements. Table 3 shows the dataset that was used in the case study. The distribution indicates that each artistic movement provides an equal or close-to-equal number of works of art, which is why the comparative analysis between periods is significant. Karthikeyan et al. (2023)
Table 3
|
Table 3 Digital Art Dataset Composition |
|||
|
Artistic Movement |
Time Period |
Number of Artworks |
Dominant Themes |
|
Renaissance |
1500–1600 |
300 |
Religious scenes,
portraits |
|
Baroque |
1600–1700 |
280 |
Dramatic portraiture,
mythology |
|
Impressionism |
1800–1890 |
310 |
Landscapes, everyday
life |
|
Modernism |
1900–1970 |
310 |
Abstract forms,
conceptual art |
The quantification of aesthetic attributes of the artworks as in Table 3 was done as a result of visual feature extraction algorithms. Palette diversity was measured using the color histogram analysis and the complexity of brushstrokes was measured using the texture analysis. The variability of composition was determined by metric of edge detection and spatial distribution.
Table 4
|
Table 4 Extracted Visual Feature Indicators |
|||
|
Artistic Movement |
Color Diversity Index |
Texture Complexity |
Composition
Variability |
|
Renaissance |
0.42 |
0.50 |
0.44 |
|
Baroque |
0.48 |
0.56 |
0.49 |
|
Impressionism |
0.67 |
0.62 |
0.60 |
|
Modernism |
0.73 |
0.68 |
0.72 |
The findings show a definite trend of increasing the complex of the styles throughout the periods. The paintings of the renaissance period show comparatively good harmony and a lack of variety of colors, which depict the classical style of art. The paintings of the Baroque have more texture and dynamism in the composition, which is related to the dramaticity of art of those times. The appearance of the impressionist artworks has a massive growth in diversity of colors because of the exploration of light and nature sceneries as indicated in Table 4. The stylistic variability is the greatest in the modernist artworks which imply the movement towards abstraction and conceptual artistic forms. To study more the popularity and interest that is linked to the various visual styles, another indicator was computed based on normalized viewer engagement scores based on online exhibition data. Rawandale et al. (2022)
Table 5
|
Table 5 Popularity and Engagement Analysis |
|||
|
Artistic Movement |
Average Viewer
Engagement Score |
Style Diversity Score |
Cluster Group |
|
Renaissance |
65 |
0.48 |
C1 |
|
Baroque |
70 |
0.55 |
C2 |
|
Impressionism |
82 |
0.66 |
C3 |
|
Modernism |
88 |
0.75 |
C4 |
The review shows that the trends of art that have greater stylistic variety and the use of colors are more likely to have more active viewers. Cultural analytics is thus an effective, data-driven method of detecting aesthetic tendencies in digital art collections and how visual culture has been changing over time. Findings of such case studies indicate the possibilities of cultural analytics to reveal patterns among large collections of art data in the format of Table 5. The quantitative results can show, e.g., the growing diversity of colors used in the course of modern art trends or the changing the topic depiction responding to social and cultural changes. Veeravalli et al. (2025)
7. Visualization of Artistic Evolution Using Data Analytics
The visualization methods are essential in the interpretation of the intricate patterns detected by the cultural analytics. Visual arts data Big data visual arts datasets usually have thousands of art images and many visual features, and it is difficult to interpret the result of the analysis without the efficient use of graphs. Data visualization techniques convert numerical results into visual formats which allow the researcher to see trends, correlation and structural relationship of cultural data. The use of time-series visualization is typically utilized to demonstrate the changes in aesthetic qualities between historical eras. One example is that line charts may show how the average color intensity, brightness or texture complexity changes with time. Such visualizations indicate the trends of time that could be related to some artistic movements or the shift in culture. Analyzing such charts, the researchers are able to discover the moments of the active stylistic alteration or moments at which specific aesthetic means are prevalent in the works of art.
Table 6
|
Table 6 Temporal Evolution of Visual Style Attributes |
||||
|
Period |
Avg Color Intensity |
Texture Complexity |
Composition
Variability |
Style Diversity Score |
|
1600–1700 |
0.45 |
0.52 |
0.4 |
0.48 |
|
1700–1800 |
0.50 |
0.58 |
0.47 |
0.55 |
|
1800–1900 |
0.62 |
0.64 |
0.60 |
0.66 |
|
1900–2000 |
0.74 |
0.70 |
0.72 |
0.75 |
Cluster visualizations are used to visualize the relationship between artworks on a visual level. Artworks can be represented in a two-dimensional space by scatter plot or dimensionality reduction techniques like principal component analysis and an area of proximity represents a stylistic similarity as presented in Table 6. The pieces of art of the same artistic movement can be seen to congregate in certain areas of the visualization, and the works of transition can be seen between the clusters. These visual representations have an intuitive quality regarding the way artistic styles change and also how they interact with each other.
Figure 4
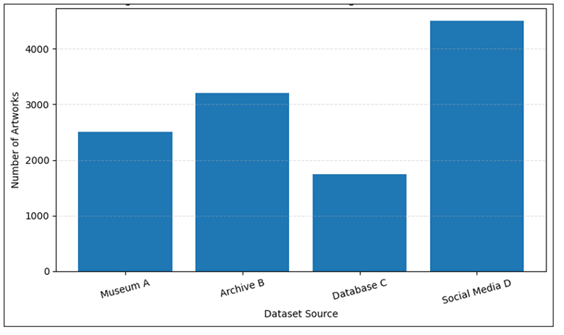
Figure 4 Distribution of Artworks Across Digital Visual Art Datasets
Relationships among artists, influences and artistic movements can also be studied using networks visualization as shown in Figure 4. Network graphs may be used to depict relationships between artists that have similar visual characteristics or themes in their art. Artists or works of art are represented as nodes of a network, and connections among them are represented as edges, e.g. style similarity or historical impact.
Figure 5

Figure 5 Temporal Evolution of Key Aesthetic Attributes
Such visualizations expose the inter-relational nature of the visual culture and indicate the permeation of the aesthetic concepts among the artistic spheres. Visualization thus becomes very important in the cultural analytics where computational analysis is merged with human interpretation as illustrated in Figure 5. Proper visualizations enable researchers, curators and cultural institutions to investigate complicated cultural datasets and convey analytical conclusions in a straightforward and significant way. Hazarika et al. (2019)
8. Results and Trend Analysis
The analytical findings of the cultural analytics can be very helpful in understanding the development of aesthetic values of visual art. Through the use of data science on large art collections, researchers are capable of identifying quantifiable trends that can help describe the changes in artistic modes, subject matter, and visual composition as a historical event. These results prove that the computational approaches can be used to supplement the qualitative analysis in artistic development. A major outcome that is nearly always witnessed in cultural analytics research is the development of color palettes in artistic movements. The quantitative study of color histogram data could show the growing variety of color use in modern and contemporary art periods of time when compared to earlier classical traditions. Color variance and brightness statistical measurements tend to show that artists started to play around with color and contrasting color combinations more vivid and dramatic during the Impressionism and Post-Impressionism movements. These results conform to the interpretations of art history according to which these movements focused on light, atmosphere, and perception.
Figure 6

Figure 6 Relationship Between Color Diversity and Popularity
The results of cluster analysis can also point out certain stylistic groupings in the dataset as shown in Figure 6. Artificial intelligence algorithms that classify artworks based on visual similarity have been used to create clusters that can be associated with popular movements in art history, including Renaissance, Baroque, Impressionism, and Modernism.
Figure 7

Figure 7 Heatmap of Aesthetic & Engagement Indicators by Movement
The transitional clusters can expose artworks that cross stylistic lines indicating an experimentation and transition in the culture. These findings will offer quantitative data to back the historical accounts regarding the development of visual art as in Figure 7. Thematic metadata trend analysis can also be used to identify shifts in subject matter description over time.
Figure 8
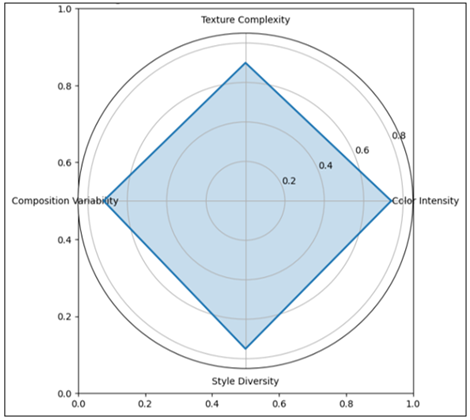
Figure 8 Multi-Metric Aesthetic Profile For 1900–2000
These thematic evolutions are generally pegged on the overall cultural and social trends that influence the means of artistic expression as it is represented in Figure 8. The analysis of the visual features, clustering results, and the data of the development of aesthetics of visual arts provide the full image of the development of aesthetics in this sphere. Cultural analytics therefore gives researchers the opportunity to track the trends both at micro-level and macro-level with a detached perspective of how the creativity in arts develops over time and cultural contexts.
9. Future Directions in Cultural Analytics
It is likely that the future of cultural analytics in any visual arts research will be shaped by the influence of the emerging technologies, as well as expanding digital cultural datasets. The creation of artificial intelligence, particularly the deep learning and computer vision, provides very effective solutions that allow processing increasingly complex visual data. With these technologies, it is possible to recognize artistic styles, objects, and visual patterns of works of art automatically to make large-scale analyses that were never feasible previously experimentable. The other direction, which cultural analytics can take, is the combination of multimodal data sources. The data on the historical documents and the data on the audience engagement may be analyzed with the help of including the data on the visual images with the textual metadata to comprehend the historical context of the visual culture better. The patterns of the theme that could be employed, together with the analysis of the visual features, may be performed through the use of natural language processing methods on the textual description of works of art and the curatorial narratives. Such multimodal solutions are applicable to the exploration of the interaction process between the artistic production, the cultural discourse, and even the perception of the population in a greater depth. Also, there is a chance that real-time cultural analytics may turn into a significant subject of research since digital platforms continue generating serious volumes of visual contents. New art and culture is produced on a continuous basis by the activities of artistic communities and digital exhibitions, the dynamics of social media. Information about the ways the aesthetics tendencies are born and evolve in real time may be provided with the help of data science instruments that are capable of working with such dynamic datasets. These studies can help cultural organizations learn more about the visual culture, which is present today and identify new trends in art. The research of cultural analytics has greater chances to evolve along with the technological shifts such as augmented reality or virtual exhibitions. Online interactive platforms have a rich contribution of the information on how the users perceive works of art, the trends of their navigation and duration they take to interact with the piece of art. The experience with visual art among the audience in the worlds of immersive digital settings can be demonstrated by the analysis of such streams of data.
The future of cultural analytics is therefore the approach of integrating the latest computational technology to inter-disciplinary studies in the area of culture. The further collaboration between art historians, computer scientists, and other specialists in the digital humanities will be the key to the future of this field and the improved understanding of the visual culture.
10. Conclusion
Cultural analytics is a new approach to the analysis of visual art through the application of computational data science techniques, in addition to more traditional cultural analysis. With the increasing number of digitized bodies of art and massive amounts of visual information, scholars are currently in a position to employ quantitative approaches to examine aesthetic patterns, stylistic transformations, and consumer behavior. Cultural analytics offers a scholar the capability to process thousands of visual art images simultaneously through machine learning, image processing and statistical analysis and to find things that they would have likely never found in the course of a smaller scale qualitative research. The systematic scale in the analysis of the visual art datasets will be provided by a systematic computational model involving the data collection, pre-processing, feature extraction, modeling and visualization. Empirical case studies reveal that the methods could be invaluable sources of information regarding the artistic development, including the shifts in color patterns, the way in which some issues were represented, and the stylistic divisions by century. The analysis of the analytical outcome can also be enhanced by the visualization mechanisms when the complex data are in forms of the available graphical tools, which indicate the relationship between the artworks, the artists and the cultural movements. The cultural analytics have important implications on the museums, cultural policy makers and even the digital humanities initiatives. Data driven insights can inform curatorial approaches and cultural heritage conservation, and enhance the way people can be engaged in art. At the same time, scientists must address the methodological problems that are related to the bias of data in datasets, data interpretation of the algorithm, and ethical considerations of the cultural heritage data analysis. The range of cultural analytics will likely expand with the further evolution of artificial intelligence, multimodal processing of data, and online cultural systems. The synthesis of both the computational analysis and the humanistic scholarship will play an inevitable role in the process of ensuring that quantitative methods do not hypothetically replace the interpretative cultural studies. This means that cultural analytics is an effective means of understanding the dynamic change of the visual culture in the progressively digitalized world.
CONFLICT OF INTERESTS
None.
ACKNOWLEDGMENTS
None.
REFERENCES
Desikan, B. S., Shimao, H., and Miton, H. (2022). WikiArtVectors: Style and Color Representations of Artworks for Cultural Analysis Via Information Theoretic Measures. Entropy, 24(9), 1175. https://doi.org/10.3390/e24091175
Dingankar, S., Dixit, R., Jadhav, K. D., Bathla, G., Rane, M. E., and Raina, A. (2025). Synthesizing Best Practice Frameworks for Enhancing Financial Literacy Support in Microenterprise Lending. Enterprise Development and Microfinance, 35(1), 263–282. https://doi.org/10.3362/edm.v35i1.21
Fu, H., Fu, L., Dávid, L. D., Zhong, Q., and Zhu, K. (2024). Bridging Gaps Towards the 2030 Agenda: A Data-Driven Comparative Analysis of Government and Public Engagement in China Towards Achieving Sustainable Development Goals. Land, 13(6), 818. https://doi.org/10.3390/land13060818
Hazarika, I., et al. (2019). Role of HR Metrics in Enhancing Firm Performance of Selected UAE Airline Companies. Academy of Strategic Management Journal, 18(6), 1–8.
Howard, F. (2022). Artistic Production and (re)Production: Youth Arts Programmes as Enablers of Common Cultural Dispositions. Cultural Sociology, 16(4), 468–485. https://doi.org/10.1177/17499755211066371
Inisatool, O., and Phuakkhong, C. (2025). Poverty Reduction Through Community Enterprises in Thailand.
International Journal of Research and Development in Management Review, 14(1),
29–34. https://doi.org/10.65521/ijrdmr.v14i1.103
Karthikeyan, J., Vasanthan, R., Sundari, P. S., Nandhini, T. J., and Devi, V. C. (2023). Construction and Implementation of English Translation Simulation Training Classroom Based on Deep Learning. 2023 2nd International Conference on Smart Technologies for Smart Nation (SmartTechCon 2023), 716–719. https://doi.org/10.1109/SmartTechCon57526.2023.10391666
Kashyap, S. V., Purohit, S., Kumar, D. A., Jawaid, F. I. M., Kumar, J. R. R., and Ajani, S. N. (2025). Visual Storytelling and Explainable Intelligence in Organizational Change Communication. ShodhKosh: Journal of Visual and Performing Arts, 6(5s), 696–707. https://doi.org/10.29121/shodhkosh.v6.i5s.2025.6965
Kulikova, E. Y. (2021). Vitaly Ryabinin’s Japanese watercolors: Genre and Stanza Experiments. Siberian Philological Journal, 3, 100–112. https://doi.org/10.17223/18137083/76/8
Labadi, S., Giliberto, F., Rosetti, I., Shetabi, L., and Yildirim, E. (2021). Heritage and the Sustainable Development Goals: Policy Guidance for Heritage and Development Actors. ICOMOS.
Lee, B., Seo, M. K., Kim, D., Shin, I. S., Schich, M., Jeong, H., and Han, S. K. (2020). Dissecting Landscape Art History With Information Theory. Proceedings of the National Academy of Sciences, 117(42), 26580–26590. https://doi.org/10.1073/pnas.2011927117
Lyu, H., Rosin, P. L., and Lai, Y.-K. (2023). WCGAN: Robust Portrait Watercolorization with Adaptive Hierarchical Localized Constraints. Displays, 80, 102530. https://doi.org/10.1016/j.displa.2023.102530
Rawandale, U. S., Ganorkar, S. R., and Kolte, M. T. (2022). Audiogram Study in Filter Bank Used for Hearing Aid System to Enhance the Performance. 2022 6th International Conference on Computing, Communication, Control and Automation (ICCUBEA), 1–4. https://doi.org/10.1109/ICCUBEA54992.2022.10010832
Shinabargar, S. (2023). Colour and Composition in the Work of Jean Follain. French Studies, 77(3), 252–271. https://doi.org/10.1093/fs/knad039
Sinclair, N. C., Ursell, J., South, A., and Rendell, L. (2022). From Beethoven to Beyonce: Do Changing Aesthetic Cultures Amount to “Cumulative Cultural Evolution”? Frontiers in Psychology, 12, 663397. https://doi.org/10.3389/fpsyg.2021.663397
Veeravalli, S. D., Patil, P. A., Porwal, T., Karwande, V. S., Budhewar, A. S., and Nanche, B. M. (2025). Adaptive-Personalised Federated Deep Learning for Privacy-Aware NAFLD Screening. International Conference on Innovations in Intelligent Systems: Advancements in Computing, Communication, and Cybersecurity (ISAC3 2025). https://doi.org/10.1109/ISAC364032.2025.11156569
Vijayakumar, M., Muniyandy, E., and Mirajkar, G., et al. (2026). Intrusion Detection and Localization Using Deep Learning Approaches in VANET Environments. SN Computer Science, 7, 234. https://doi.org/10.1007/s42979-026-04769-0
Wang, Q. (2022). Design of Watercolor Cultural and Creative Products Based on Style Transfer Algorithm. Mathematical Problems in Engineering, 2022, 1–9. https://doi.org/10.1155/2022/2711861
Wen, X., and White, P. (2020). The Role of Landscape Art in Cultural and National Identity: Chinese and European comparisons. Sustainability, 12(13), 5472. https://doi.org/10.3390/su12135472
Yao, C., Tian, T., Gao, C., Zhao, S., and Liu, Q. (2022). Visual Performance of Painting Colors Based on Psychological Factors. Frontiers in Psychology, 13, 966571. https://doi.org/10.3389/fpsyg.2022.966571
Zhang, C., Huang, J. B., Zhu, T. Q., and Zhang, R. L. (2021). Guangzhou Tongcao Painting in Late China Qing Dynasty (1840–1912 AD): Technology Revealed by Analytical Approaches. Heritage Science, 9(1), 10. https://doi.org/10.1186/s40494-020-00472-2
Zhang, L. (2022). Scenography and the Production of Artworks in Contemporary Art. Cultural Sociology, 17(2), 179–203. https://doi.org/10.1177/17499755221076922
|
|
 This work is licensed under a: Creative Commons Attribution 4.0 International License
© ShodhKosh 2026. All Rights Reserved.