ShodhKosh: Journal of Visual and Performing ArtsISSN (Online): 2582-7472
|
|
Predictive Analytics for Print Supply Chain Management
Dr. Prabha D. 1![]() , Shwetambari Pandurang Katake 2
, Shwetambari Pandurang Katake 2![]() , Kalpana
Rawat 3
, Kalpana
Rawat 3![]() , Dr.
Vikrant Nangare 4
, Dr.
Vikrant Nangare 4![]() , Aakash
Soni 5
, Aakash
Soni 5![]() , Shanthi
V. 6
, Shanthi
V. 6![]()
1 Assistant
professor, School of Business and Management, St. Francis de Sales College,
(Autonomous), Electronics City, Bengaluru, India
2 Department
of Computer Engineering, Vishwakarma Institute of Technology, Pune,
Maharashtra, 411037, India
3 Assistant Professor, School of Business Management, Noida
International University, Greater Noida 203201, India
4 Assistant Professor, Bharati Vidyapeeth (Deemed to be University), Institute
of Management and Entrepreneurship Development, Pune 411038, India
5 Department of Mechanical Engineering, Shri Shankaracharya Institute of
Professional Management and Technology, Raipur, Chhattisgarh, India
6 Professor, Meenakshi College of Arts and Science, Meenakshi Academy of
Higher Education and Research, Chennai, Tamil Nadu 600102, India
|
|
|
ABSTRACT |
|
|
Predictive
analytics have become one of the most important facilitators of data-driven
decision-making in supply chain management, yet the system is not actively
used in the print industry, despite the growth of the complexity of
operations and the unpredictability of demand. The nature of print supply
chain is also marked by job production, non-homogeneous materials, short-term
planning, and inflexible delivery schedules that diminish the efficiency of
conventional reactive planning strategies. This paper explores the
application of predictive analytics in print supply chain management and
suggests a common end to end model that combines data collection, feature
engineering, predictive model and decision support into an integrated
operational pipeline. It suits various predictive paradigms such as classical
time-series models, feature-based ensemble learning, and sequence-based deep
learning so that it can flexibly adapt to data maturity like data need
depending on the decision requirement. Through an experimental analysis of
representative datasets of print supply chains, machine learning-based models
are proven to be more effective in improving the accuracy of demand
forecasting and minimizing extreme prediction errors over traditional
baselines. More to the point, the combination of predictive outputs to the
planning and execution processes results in quantifiable service-level
benefits, such as increased on-time delivery, increased inventory fill rates,
decreased stock-out rate, and decreased unplanned downtime. The results
validate the claims that predictive analytics actually improves the
resilience of the print supply chain by reducing the occurrence of the
high-impact forecast failures and allowing risk-sensitive proactive
decision-making. The suggested framework offers an effective basis of the
further development of intelligence-driven supply chain management in
contemporary print production settings. |
|||
|
Received 12 September 2025 Accepted 09 December 2025 Published 17 February 2026 Corresponding Author Dr Prabha
D, prabhad@sfscollege.in DOI 10.29121/shodhkosh.v7.i1s.2026.7099 Funding: This research
received no specific grant from any funding agency in the public, commercial,
or not-for-profit sectors. Copyright: © 2026 The
Author(s). This work is licensed under a Creative Commons
Attribution 4.0 International License. With the
license CC-BY, authors retain the copyright, allowing anyone to download,
reuse, re-print, modify, distribute, and/or copy their contribution. The work
must be properly attributed to its author.
|
|||
|
Keywords: Predictive Analytics, Print Supply Chain Management,
Demand Forecasting, Machine Learning, Inventory Optimization, Service-Level
Improvement, Industry 4.0 |
|||


1. INTRODUCTION
The print industry is still operating as a multi-level supply chain that makes use of raw materials suppliers, prepress operations, printing units, finishing processes, warehousing, logistics vendors and distribution routes. Although there is growing digitalization in content production, the physical aspect of print production places strict limitations in terms of inventory control, production schedule, wastage of materials and delivery schedules Oliveira et al. (2022). Unstable demand cycles, small batch print orders, customization, and sustainability issues intensify these issues even further. This means that conventional reactive planning and decision-making processes that are developed according to heuristic cannot be used to effectively manage the current print supply chain Li (2022). Predictive analytics has been considered an essential enabler of data-driven decision support in supply chain activities. Predictive analytics allows organizations to predict future events, be able to spot threats and optimally plan the use of resources through the use of historical data, real time operational signals and advanced machine learning algorithms Tiedemann et al. (2021). When applied to the print supply chain management (PSCM), predictive models would enable predetermining the demand of the print jobs, estimating the material use, anticipating machine downtimes, optimizing inventory refill, and enhancing delivery performance Kouvelis and Qiu (2021). These features directly lead to cost savings, improvement in service levels as well as operational resilience as shown in Figure 1.
Figure 1
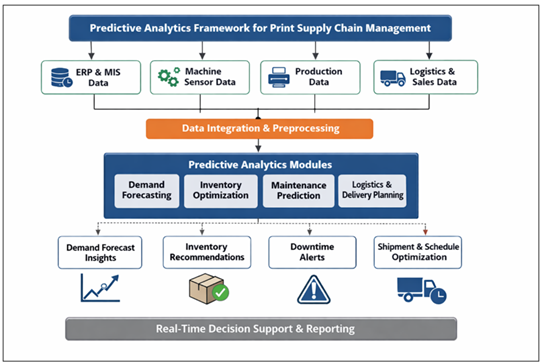
Figure 1 Basic Block Schematic of Predictive Analytics of
Supply Chain
Nonetheless, the use of predictive analytics in the print industry is still disjointed. In contrast to high-volume production supply chains or retail supply chains, print supply chains are characterized with the domain specific complexities of production based on jobs, heterogeneous substrates, variable ink use, constant changeovers and hard customer deadlines Nagy-Bota et al. (2023). These features require custom data modeling plans and predictive models to support print activities instead of a direct adoption of generic supply chain analytics solutions. Moreover in the print context, data sources are usually isolated within enterprise resource planning (ERP) systems, print management information systems (MIS), machine sensors and logistics platforms, and have challenges of integration and data quality Tirkolaee et al. (2021). The paper bridges these gaps by critically considering the place of predictive analytics in the supply chain management in print. The paper presents a platform of predictive analytics which combines demand forecasting, inventory forecasting, and production risk forecasting and logistics optimization into a cohesive decision-support platform Jahin et al. (2024). The paper illustrates how the insights, facilitated by analytics, can promote the end-to-end supply chain visibility and responsiveness by mapping print-specific operational data to relevant predictive modeling tools. It is anticipated that the outputs of this work can assist print service providers, publishers and industrial printers in shifting their supply chain control approaches to proactive and intelligence-based management practices based on the principles of Industry 4.0 Wang et al. (2022).
2. Print Supply Chain Ecosystem and Data Characteristics
The print supply chain ecosystem contains a job based and multi-stage production structure that enables it to be fundamentally different to continuous or mass manufacturing supply chains. It generally extends upstream to the suppliers of raw materials (paper, ink, plates, consumables), internal prepress and production, finishing and pack and third-party logistics suppliers, distributors or end customers Wang and Aviles (2023). The use of tight time constraints on each stage is caused by the customer deadlines, variable orders volumes, and frequent customization needs. Consequently, the responsiveness of the print industry to changes in demand, material availability, machine performance, and the efficiency of coordination between actors makes supply chain performance extremely fragile in the industry Patil et al. (2023). One characteristic of the print supply chains is the heterogeneity of information that is produced at different levels of operation. Enterprise resource planning (ERP) and management information systems (MIS) record transactional data at the planning and control level with regards to customer orders, job specifications, pricing, procurement and invoicing Tseng et al. (2022). These data are generally organized, event based and historical and hence are applicable in demand prediction as well as order patterns. At the shop-floor, production systems yield semi-structured and streaming data, such as machine utilization records, job queues, setup times, ink and substrate records and quality indicators Ozdemir et al. (2022). As Industry 4.0 technologies keep gaining momentum, sensor-based printing devices add time-series information of high frequency to temperature, vibration, and print head performance, as well as downtime phenomena.
Table 1
|
Table 1 Conceptual Mapping of Print Supply Chain Data to Predictive Analytics Objectives |
|||
|
Print
Supply Chain Data Category |
Representative
Data Elements |
Primary
Predictive Objective |
Typical
Predictive Output |
|
ERP
/ MIS Data Panahi et al. (2022) |
Order
history, job specifications, pricing, lead times |
Demand
forecasting and order volume prediction |
Forecasted
job load, demand trends |
|
Production
& Machine Data Saha et al. (2022) |
Setup
times, run times, ink usage, defect rates |
Production
risk and throughput prediction |
Delay
probability, capacity utilization |
|
Sensor
& Maintenance Data Abdallah and Nizamuddin (2023) |
Vibration,
temperature, error logs, downtime events |
Predictive
maintenance and failure detection |
Downtime
alerts, maintenance schedules |
|
Inventory
& Procurement Data Trautmann et al. (2022) |
Paper
stock levels, ink consumption rates, supplier lead times |
Inventory
optimization and replenishment planning |
Reorder
points, safety stock levels |
|
Logistics
& Distribution Data Kartoglu and Ames (2022) |
Shipment
times, delivery deviations, carrier performance |
Delivery
time prediction and logistics optimization |
ETA
estimates, route recommendations |
Besides internal operation data, external and contextual data sources are presented by the logistics and distribution activities. These are shipment schedules, transit times, carrier performance records, delivery deviations and return rates. Sales and frontline systems provide some of the demand cues as seasonal, repeat order patterns, committed contracts, and job requests on short notice Shen (2025). The presence of historical data, real-time data, structured data and unstructured data poses a great challenge to data integration, synchronization and Gaikwad and Damodaran (2024) assurance of quality. It can however be a rich source of predictive analytics to a good extent when modeled accordingly Mao et al. (2024). In order to explain how different sources of data in the print supply chain could support predictive decision-making goals, Table 1 conceptually maps the major types of data to their respective analytical functions and predictive outcomes. This mapping points out the need to feature engineer and select analytics in a domain sensitive manner to print operations and not in generic supply chain environments Ma (2021).
3. Predictive Analytics Techniques for Print Supply Chain Management
Due to the high level of variability of products and substrates used in jobs and frequent disruptions in the operational process due to changeovers, machine conditions, and uncertainty in supplier lead-time, predictive modeling in print supply chain management (PSCM) has to consider the demand per job, high frequency of variability, and interruptions in the operation process Pan et al. (2022). As opposed to steady high-volume production, print jobs can be intermittent (e.g., campaign-driven spikes), short-horizon (rush jobs), nonstationary (because of price changes), seasonal (also due to changing customer preferences), etc. The choice of predictive models must therefore be based not just on the accuracy of the forecasts but also on the interpretability, availability of data, update speed and whether they will allow the use of exogenous operational signals like promotions, scheduled maintenance, and materials Amjad (2022).
Classical time-series models like the Autoregressive Integrated Moving Average (ARIMA) family are still applicable to print SCM when the variable of interest is mainly univariate and the time series, e.g. daily/weekly order volume, substrate consumption or dispatch counts. ARIMA is effective especially when past demand has constant seasonality and the aim is to forecast short term predictabilities with the least amount of computations Mohammed (2024). ARIMA is a good baseline in most print companies with a limited level of data maturity like ERP/MIS order logs since it is transparent and simple to implement. Nevertheless, in PSCM situations with non-linear demand drivers, intermittent demand drivers, or highly exogenous demand drivers (e.g., marketing campaigns, institutional calendar, customer contract cycle), ARIMA is normally not very effective, and it does not exploit high-dimensional effects (e.g., job attributes, paper GSM, color pages, finishing type), machine availability, or supplier delays without considerable manual modeling extensions. XGboosting and other gradient boosting techniques are also a viable and frequently better method of PSCM because they can learn nonlinear interactions among heterogeneous structured data.
Table 2
|
Table 2 Comparative View of ARIMA vs. XGBoost vs. LSTM for Print Supply Chain Use-Cases |
|||
|
Model |
Best
Fit in Print SCM |
Strengths
in PSCM Context |
Common
Limitations in PSCM |
|
ARIMA |
Short-horizon
forecasting of order volume, substrate usage, dispatch counts |
Lightweight,
interpretable, strong baseline with stable seasonality |
Weak
with nonlinear drivers, intermittent demand, limited exogenous integration |
|
XGBoost |
Delay
risk prediction, material consumption estimation, lead-time prediction using
job + ERP features |
Handles
nonlinearities, mixed features, strong accuracy, explainable via feature
importance/SHAP |
Needs
engineered temporal features; sequence effects not “native” |
|
LSTM |
Predictive
maintenance, downtime/quality drift prediction from time-series logs; complex
multivariate demand |
Captures
long temporal dependencies; effective with high-frequency streams |
Data-hungry,
harder to interpret, higher deployment complexity |
A hybrid approach can also be operationally efficient in practice in print SCM deployments: ARIMA creates a clear forecasting point of reference in the planning process, XGBoost is used to obtain more accurate structured predictions to support decision making, and LSTM is used to address sensor-intensive applications like maintenance and quality risk forecasting. This multi-tiered model approach can be effective in the case of print companies that are currently moving their ERP-based planning to Industry 4.0-based predictive control so that they can gradually adopt the concept without disrupting the production process. This proves especially useful when the predictive objective is not a time-series prediction, but a supply chain decision variable like the probability of delay, the material consumption expected, or the risk of reprint because of defects. XGBoost also offers a relatively good interpretability in form of feature importance and SHAP-based explanations which is useful in production planning teams to have an operational acceptance of the XGBoost.
It can be limited in PSCM when the time structure is important and long-range correlation is important; naive feature engineering (lags/rolling window) might be needed to capture sequence effects and the ability of the model to utilize the data streams may be reduced unless refining engineered features is done regularly. Long Short-Term Memory (LSTM) networks and other recurrent deep learning models are most applicable in PSCM contexts when intricate temporal relationships, time series with high frequencies, or a multivariate sequence have an impact on results. To use an example, machine sensor streams and production logs can be used in LSTM models to forecast marches, degraded throughput, or quality drifts within a machine prior to failure, so that predictive maintenance and hardy schedule correction can be implemented. On the same note, in the case of demand forecasting, LSTMs can capture non-linear seasonality as well as irregular patterns, as long as the depth of history is great enough and there is a number of exogenous sequences (e.g., web-to-print inquiries, quotation volume, sales pipeline signals) to do so. The major drawbacks of LSTM in most print organizations are (i) larger dataset and continuous data collection are required (ii) LSTM is more challenging to compute and deploy and (iii) less transparent than boosting models, which can limit trusting LSTM in planning situations unless accompanied by explainability methods.
4. Proposed Unified Predictive Analytics Framework
The suggested predictive analytics package in the management of print supplies chain (PSCM) is developed as a unified end-to-end pipeline, which is modular and converts heterogeneous data of operation into decision-oriented intelligence. The framework clearly matches the data acquisition with the feature engineering, predictive modeling and decision support layers to respond to the structural and operational complexity of print production setting. The framework is job-based (in contrast to generic supply chain analytics architectures), has short planning horizons, and is highly variable (in materials, machine usage and customer demand) in its print workflows. The base of the framework is the data acquisition and integration layer, where data is brought together by combining information of various internal and external sources. Its core inputs are the ERP and MIS systems that capture the order metadata, job specifications, pricing and promised delivery date; production systems that record set up times, run times, waste rate, and quality measure; machine/ sensor streams that provide signals to monitor the condition, inventory and procurement databases that record the stock levels and supplier lead times; and logistics platforms that help track shipment execution and delivery latencies.
Considering the multifaceted nature of these sources the framework focuses on data matching, time matching as well as validation to achieve uniformity between planning and execution horizons. Integrated information is brought to a single point of centralized feature store and preprocessing layer as the analytical backbone of the structure. This layer performs the transformation of raw transactional and time-series data into semantically meaningful features based on the print SCM decision variables as shown in Figure 2 The examples are rolling demand aggregates by substrate and customer segment, job complexity indices based on the number of pages and finishing requirements, machine load and utilization indicators, lagged downtime indicators and inventory risk indicators based on consumption velocity and supplier reliability.
Figure 2

Figure 2 Proposed Unified Predictive Analytics Framework
The predictive model layer is the heart of the intelligence of the framework, and it facilitates the various modeling paradigms simultaneously. The classical time-series models are utilized in stable and short-term forecasting problems, whereas tree-based ensemble models are used to describe nonlinear relationships among structured operational characteristics. The division of deep sequence models are selectively used in sensor driven and high frequency prediction problems, like maintenance and quality risk estimation. The standardized model outputs are probabilistic or interval based predictions to enable risk-judicious decision-making as opposed to point estimates.
The decision support and execution layer is the first layer at the top of the pipeline and it converts predictive insights into operational activities. Outputs of forecasting can be used to plan capacity and to purchase materials, predict delays and risks initiate proactive adjustments of the schedule, condition-based interventions are supported by maintenance alerts, and dynamic delivery planning is supported by logistics forecasts. These insights are presented in the form of dashboards, alerts, as well as API connectivity to the current planning and execution systems and are designed in such a way that predictive analytics complements rather than distraacts the existing workflows. Notably, the framework allows feedback loops whereby the actual results are fed back to the data layer to allow the recalibration of the model and monitor performance.
5. Analysis and Interpretation of Results
The suitability of the suggested predictive analytics framework of the print supply chain management (PSCM) is assessed by considering a joint examination of the forecasting accuracy and operational service-level results. Instead of looking at the performance of predictions in isolation, the interpretation is focused on the spread outlooks of the enhancement of predictive accuracy on real supply chain gains in terms of decreased stock-outs, enhancements in schedule predictability and better on-time deliveries. Mean Absolute Percentage error (MAPE) and root mean square error (RMSE) are used in the evaluation of forecasting performance based on demand and material consumption.
Table 3
|
Table 3 Forecast Accuracy Comparison for Print Demand and Material Consumption |
|||
|
Model |
MAPE
(%) |
RMSE |
Observed
Behavior in Print SCM |
|
ARIMA |
12.8 |
186.4 |
Stable
for regular demand, slow adaptation to spikes |
|
XGBoost |
8.3 |
121.7 |
Strong
performance under variable job mix and seasonality |
|
LSTM |
8.1 |
118.9 |
Effective
for long temporal patterns, higher variance in low-data periods |
The outcomes reveal that although ARIMA is a sound base used to stay in print environments that are stable, it fails in situations where there are short-run jobs, promotional print campaigns, and irregular arrivals of orders. XGBoost has been able to record the smallest error over most evaluation times because the model utilizes structured features in operations like complexity of jobs, frequency on customers and recent workload trends. The improvement in RMSE by LSTM is relatively slight in situations with large amounts of data but does not grow consistently across time indicating diminishing returns in case of limited historical depth or signal continuity. Predictive outputs are incorporated in operational impacts evaluation and compared with the workflow planning and with the baseline (reactive) decision policy.
Table 4
|
Table 4 Service-Level Improvement Achieved Using Predictive Analytics |
|||
|
Performance
Metric |
Baseline
(%) |
Predictive
Analytics (%) |
Relative
Improvement |
|
On-Time
Delivery Rate |
84.2 |
91 |
8.10% |
|
Inventory
Fill Rate |
88.5 |
94.6 |
6.90% |
|
Stock-Out
Frequency |
9.4 |
4.1 |
−56.4% |
|
Unplanned
Downtime Incidents |
7.8 |
4.9 |
−37.2% |
The service-level outcomes indicate that predictive analytics provides significant gains in operations besides statistical accuracy. Better demand forecasts translate directly to better availability of materials and this helps to eliminate production disruptions due to a shortage of paper or ink. The predictions of delay risk provide proactive resequencing of jobs and maintenance interventions, resulting in a quantifiable decrease in unexpected downtimes and deviation of delivering times.
6. Interpretation of Findings (With Embedded Figures)
Experimental results allow conclusively that predictive analytics can offer the most value in print supply chain management (PSCM) in the context of measuring its operational capabilities instead of forecasting accuracy per se. Results interpretation is a combination of both the statistical performance and the service-level results to describe how the predictive insights transform the plan, implementation, and coordination of the print supply chain. The comparative forecast patterns as demonstrated in Figure 3 indicate that each of the assessed models has some fundamental behavioral differences. The ARIMA forecast has a distinct lag in times of sudden demand increase as is the case with campaign based spikes found in commercial print projects.
This lag is indicative of the fact that the model is dependent on historical continuity and is less able to consider contextual job-level information. However, contrary to XGBoost forecast, the trend is much closer to actual demand fluctuations, which is more rapid in adapting to structural changes in order volume. This is responsiveness can be explained by the fact that the model enhances heterogeneous operation characteristics which are job mix, customer recurrence, and near-term backlog indicators. The LSTM forecast gives smoother curves that are more effective in fidelity to longer-term temporal dependencies; nevertheless, they sometimes over-explicit when reversing rapidly, which suggests it is sensitive to sequence dominance when there is a short-term shock. On the one hand, Fig. 5 validates that feature-based machine learning models fit more of the volatile and job-based demand patterns of PSCM.
Figure 3
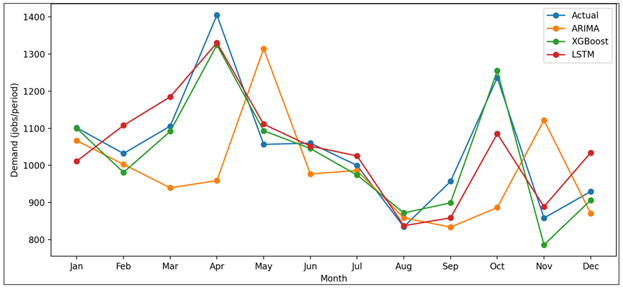
Figure 3 Forecast vs. Actual Print Demand
In addition to the demand tracking, the service-level implications of predictive integration are mentioned in Figure 3 that compares the results of baseline planning and decisions enhanced by predictive analytics. The fact that the on-time delivery rate has improved indicates the effectiveness of identifying the presence of demand surges and delay risks early in order to stabilize downstream execution. Equally, the trend in the rise of inventory fill rate and the steep decline in the number of stock-outs represent that even small gains in consumption forecasting can be significantly beneficial in material availability in print operations where production continuity is extremely sensitive to the lack of substrates and inks. The decrease in unplanned downtime also speaks of the contribution of predictive maintenance alerts towards proactive intervention. Notably, these returns can be realized without augmenting resource intensity, which is a key reason as to why predictive analytics enhance the efficiency of coordination, and not capacity growth.
Figure 4

Figure 4 Service-Level Outcomes: Baseline vs Predictive
Analytics
To learn about the reason why improvements because of forecasting translate into disproportional operation gains, translate Figure 4 looks at the distribution of absolute percentage error over models. The ARIMA error distribution is characterized by heavy tails, and it has more chances of extreme forecast misses, which are the most disruptive to the performance of the print supply chain. XGBoost highly condenses the error distribution, and the error increases in frequency, leading to emergency procurement, disruption of the schedule, and missed delivery promises. Although LSTM also minimizes extreme errors compared to ARIMA, the distribution of the former is broader compared to that of the latter in data-constrained environments. This discussion shows that forecasting error with reduced tail-risk as opposed to minimizing average error per se is a key process by which predictive analytics enhances PSCM resilience.
Figure 5

Figure 5 Forecast Error Distribution (APE) Across Models
Combined, the figures in the embedded further support the overall understanding of this paper: predictive analytics can support the performance of the print supply chain by stabilizing the decision-making in case of uncertainty. Better prediction monitoring Figure 5. The 5 makes it possible to plan proactively, service-level uplift is the captured operational benefit, and the distribution of errors compression is the inherent risk-reduction action. These results confirm the suggested unified predictive analytics framework as a viable way of transforming the print supply chains into the systems of control leveraging pro-active and intelligence-driven control.
7. Conclusion and Future Research Directions
The paper examined how predictive analytics can be used to improve the management of print supply chains through the attributes of operational peculiarities of the job-based and time-sensitive print production. A unified predictive analytics architecture was suggested, with heterogeneous sources of data, feature engineering, various predictive modeling paradigms, and decision-support systems being incorporated into a unified end-to-end pipeline. As experimental analysis revealed, machine learning driven models and in particular feature driven ensemble models are much better than the classical forecasting models under the presence of demand volatility and operational interpretability. What is more important is that the findings have affirmed the fact that when predictive accuracy is improved, it results in tangible gains on the service level, such as increased on-time delivery, better inventory fill rates, less frequent stock-out, and decreased unplanned downtimes. The analysis also revealed that the most important value of predictive analytics is the minimization of extreme predictive error propagation into cascading supply chain shocks, and not necessarily by optimizing average accuracy metrics. Practically, the results confirm the predictive analytics as a feasible and scalable capability of a decision-support tool to support contemporary print supply chain that is interested in shifting their planning by being reactive to proactive and risk-responsive in management. The presented structure allows gradual implementation in accordance with the level of data maturity and operational maturity and, therefore, it can be applied to most print organizations.
Future studies are advised to consider the hybrid and multi-objective models of optimization that can be used to harmonize cost, service level and sustainability in print operations. Additional directions can be real-time reinforcement learning of adaptive scheduling, more integration of IoT sensor data into predictive quality control, cross-enterprise analytics between suppliers and logistics partners to further increase end-to-end supply chain resilience.
CONFLICT OF INTERESTS
None.
ACKNOWLEDGMENTS
None.
REFERENCES
Abdallah, S., and Nizamuddin, N. (2023). Blockchain-Based Solution for Pharma Supply Chain Industry. Computers and Industrial Engineering, 177, 108997. https://doi.org/10.1016/j.cie.2023.108997
Amjad, M., et al. (2022). Prediction of Pile Bearing Capacity Using XGBoost Algorithm: Modeling and Performance Evaluation. Applied Sciences, 12(4), 2126. https://doi.org/10.3390/app12042126
Gaikwad, R. R., and Damodaran, D. (2024). The Rise of Predictive Analytics in Management Accounting: From Descriptive to Prescriptive. ShodhAI: Journal of Artificial Intelligence, 1(1), 159–167. https://doi.org/10.29121/shodhai.v1.i1.2024.54
Jahin, M. A., Shovon, M. S. H., Shin, J., Ridoy, I. A., and Mridha, M. F. (2024). Big Data–Supply Chain Management Framework for Forecasting: Data Preprocessing and Machine Learning Techniques. Archives of Computational Methods in Engineering, 31, 3619–3645. https://doi.org/10.1007/s11831-024-10092-9
Kartoglu, U., and Ames, H. (2022). Ensuring Quality and Integrity Of Vaccines Throughout the Cold Chain: The Role of Temperature Monitoring. Expert Review of Vaccines, 21(6), 799–810. https://doi.org/10.1080/14760584.2022.2061462
Kouvelis, P., and Qiu, Y. (2021). Financing Inventories with an Investment Efficiency Objective: ROI-Maximizing Newsvendor, Bank Loans and Trade Credit Contracts. International Journal of Production Research, 60(1), 136–161. https://doi.org/10.1080/00207543.2021.1987555
Li, G. (2022). Supply Chain Efficiency and Effectiveness Management Using Decision Support Systems. International Journal of Information Systems and Supply Chain Management, 15(1), 1–18. https://doi.org/10.4018/IJISSCM.305847
Ma, M., et al. (2021). XGBoost-Based Method for Flash Flood Risk Assessment. Journal of Hydrology, 598, 126382. https://doi.org/10.1016/j.jhydrol.2021.126382
Mao, F., Chen, M., Zhong, K., Zeng, J., and Liang, Z. (2024). An XGBoost-Assisted Evolutionary Algorithm for Expensive Multiobjective Optimization Problems. Information Sciences, 666, 120449. https://doi.org/10.1016/j.ins.2024.120449
Mohammed, S. I., et al. (2024). Fine-Tuned Cardiovascular Risk Assessment: Locally Weighted Salp Swarm Algorithm in Global Optimization. Mathematics, 12(2), 243. https://doi.org/10.3390/math12020243
Nagy-Bota, S., Moldovan, L., Nagy-Bota, M. C., and Varga, I. E. (2023). Mathematical Models Used in the Optimization of Supply Chains. Acta Marisiensis: Seria Technologica, 20, 27–31. https://doi.org/10.2478/amset-2023-0005
Oliveira, R., Sampaio, P., Cubo, C., Carvalho, M. S., and Fernandes, A. C. (2022). Defining the Supply Chain Quality Management Concept. In Handbook of Research Methods for Supply Chain Management. Edward Elgar Publishing. https://doi.org/10.4337/9781788975865.00025
Ozdemir, D., Sharma, M., Dhir, A., and Daim, T. (2022). Supply Chain Resilience During the COVID-19 Pandemic. Technology in Society, 68, 101847. https://doi.org/10.1016/j.techsoc.2021.101847
Pan, S., Zheng, Z., Guo, Z., and Luo, H. (2022). An Optimized XGBoost Method for prEdicting Reservoir Porosity Using Petrophysical Logs. Journal of Petroleum Science and Engineering, 208, 109520. https://doi.org/10.1016/j.petrol.2021.109520
Panahi, R., Gargari, N. S., Lau, Y. Y., and Ng, A. K. (2022). Developing a Resilience Assessment Model for Critical Infrastructures: The Case of Ports in Tackling the Impacts Posed by the COVID-19 Pandemic. Ocean and Coastal Management, 226, 106240. https://doi.org/10.1016/j.ocecoaman.2022.106240
Patil, A., Dwivedi, A., and Moktadir, M. A. (2023). Big Data–Industry 4.0 Readiness Factors for Sustainable Supply Chain Management: Towards Circularity. Computers and Industrial Engineering, 178, 109109. https://doi.org/10.1016/j.cie.2023.109109
Saha, E., Rathore, P., Parida, R., and Rana, N. P. (2022). The Interplay of Emerging Technologies in Pharmaceutical Supply Chain Performance: An Empirical Investigation for the Rise of Pharma 4.0. Technological Forecasting and Social Change, 181, 121768. https://doi.org/10.1016/j.techfore.2022.121768
Shen, X., et al. (2025). VLCIM: A Vision–Language Cyclic Interaction Model for Industrial Defect Detection. IEEE Transactions on Instrumentation and Measurement, 74, 1–13. https://doi.org/10.1109/TIM.2025.3583364
Tiedemann, F., Wikner, J., and Johansson, E. (2021). Understanding Lead-Time Implications for Financial Performance: A Qualitative Study. Journal of Manufacturing Technology Management, 32(1), 183–207. https://doi.org/10.1108/JMTM-06-2020-0247
Tirkolaee, E. B., Sadeghi, S., Mooseloo, F. M., Vandchali, H. R., and Aeini, S. (2021). Application of Machine Learning in Supply Chain Management: A Comprehensive Overview of the Main Areas. Mathematical Problems in Engineering, 2021, Article 1476043. https://doi.org/10.1155/2021/1476043
Trautmann, L., Hübner, T., and Lasch, R. (2022). Blockchain Concept to Combat Drug Counterfeiting by Increasing Supply Chain Visibility. International Journal of Logistics Research and Applications, Advance Online Publication, 1–27. https://doi.org/10.1080/13675567.2022.2141214
Tseng, M. L., Bui, T. D., Lim, M. K., Fujii, M., and Mishra, U. (2022). Assessing Data-Driven Sustainable Supply Chain Management Indicators for the Textile Industry Under Industrial Disruption and Ambidexterity. International Journal of Production Economics, 245, 108401. https://doi.org/10.1016/j.ijpe.2021.108401
Wang, F., and Aviles, J. (2023). Enhancing Operational Efficiency: Integrating Machine Learning Predictive Capabilities in Business Intelligence for Informed Decision-Making. Frontiers in Business, Economics and Management, 9, 282–286. https://doi.org/10.54097/fbem.v9i1.8694
Wang, J., Zheng, R., and Wang, Z. (2022). Supply Chain Optimization Strategy Research Based on Deep Learning Algorithm. Mobile Information Systems, 2022, Article 9058490. https://doi.org/10.1155/2022/9058490
|
|
 This work is licensed under a: Creative Commons Attribution 4.0 International License
© ShodhKosh 2026. All Rights Reserved.