ShodhKosh: Journal of Visual and Performing ArtsISSN (Online): 2582-7472
|
|
Visualizing Stress and Mindfulness: Integrating Intelligent Systems for Experiential Well-Being Practices
Silky Arora 1![]() , Dr. Shradha Vaishnav 2
, Dr. Shradha Vaishnav 2![]() , Aparna
Sharma 3
, Aparna
Sharma 3![]() , Touseef
Ahmed Lone 4
, Touseef
Ahmed Lone 4![]() , Dr.
Shiney Chib 5
, Dr.
Shiney Chib 5![]() , Suhas
Bhise 6
, Suhas
Bhise 6![]()
1 Department
of Computer Science and Engineering, CT University Ludhiana, Punjab, India,
2 Assistant
Professor, School of Wellness, AAFT University of Media and Arts, Raipur,
Chhattisgarh-492001, India
3 School of Liberal Arts, Noida International University, Noida, Uttar
Pradesh, India
4 Department of Computer Science and Engineering, CT University
Ludhiana, Punjab, India
5 Dean Academics and Research Head, Datta Meghe Institute of Management
Studies, Nagpur, Maharashtra, India
6 Assistant Professor, Department of E and TC Engineering, Vishwakarma
Institute of Technology, Pune, Maharashtra, India
|
|
|
ABSTRACT |
|
|
Stress and
mindfulness Visualized using intelligent systems are an emerging way of
performing experiential practices of well-being that use both data gathered
analytically and embodied awareness. This paper suggests an implementation of
an integrative framework in which artificial intelligence, multimodal
sensing, and interactive visualization are used to encode latent
psychophysiological indicators of stress and provide an intuitive
experiential response. The presented problem is that traditional stress measures
are not as accessible or comprehensible and, in most cases, lack the ability
to sustain mindfulness. It aims to develop a smart system that allows people
to sense, consider, and manage stress on the spot with the help of graphics
and fully interactive controls. The methodology uses wearable sensor data
containing the heart rate variability, electrodermal activity, and
respiration with machine learning models to infer the presence of stress and
patterns. These deliverables are projected to adaptive displays and immersive
interfaces that facilitate mindfulness activity, e.g., which includes
breathing control, attention, and contemplation. The experimental appraisal
proves that the subjects on the proposed system are more aware of the stress,
have better self-regulations, and are more engaged than non-visual or
stationary feedback technologies. The results show that there are measurable
decreases in the levels of perceived stress, an increase of coherence between
physiological stimuli, and an enhancement of adherence to mindfulness
practices. The innovation of moving smart analytics to experiential design
will build the proposed approach to contribute to human-centered well-being
technologies. The study underscores how visual intelligence may be used to convert
abstract stress data into valuable experience making possible the
personalization and sustainability of mindfulness interventions in the
healthcare, education and adult life context. |
|||
|
Received 23 June 2025 Accepted 08 October 2025 Published 28 December 2025 Corresponding Author Silky
Arora, silky25042@ctuniversity.in
DOI 10.29121/shodhkosh.v6.i5s.2025.6961 Funding: This research
received no specific grant from any funding agency in the public, commercial,
or not-for-profit sectors. Copyright: © 2025 The
Author(s). This work is licensed under a Creative Commons
Attribution 4.0 International License. With the
license CC-BY, authors retain the copyright, allowing anyone to download,
reuse, re-print, modify, distribute, and/or copy their contribution. The work
must be properly attributed to its author.
|
|||
|
Keywords: Stress Detection, Machine Learning, Biosensor Data,
Real-Time Feedback, Physiological Signals, Deep Learning, Wearable Technology |
|||


1. INTRODUCTION
The faster pace of life and the worry of work, school, and social obligations have made stress-related health problems much more common in modern society. It is now known that chronic worry can lead to a number of physical and mental illnesses, such as heart problems, anxiety, sadness, and problems with the immune system Jin et al. (2023). Stress is everywhere, so we need to come up with new and better ways to spot it early and help people who are experiencing it. Traditional ways of measuring stress, like self-reported surveys and professional conversations, can be helpful, but they are often subjective, look backwards, and can't give real-time information Shikha et al. (2024) Adhau and Gadicha (2024). People are moving more and more towards using bodily data and computer intelligence to make systems that automatically spot stress. Heart rate variability (HRV), galvanic skin reaction (GSR), and skin temperature are some of the most accurate ways to tell if someone is stressed Motogna et al. (2021). Wearable devices can constantly record these biosignals, which show how the body's autonomic nervous system reacts to stresses. Wearable tech and low-power biosensors have recently made it possible to collect this kind of data in real time, laying the groundwork for long-term tracking of stress Sagar and Ninoria (2022). The raw data from these sensors is often noisy and has a lot of dimensions Pecori et al. (2024). To make sure that the data can be interpreted meaningfully, it needs strong preparation, feature extraction, and pattern recognition methods.
Machine learning (ML) techniques are very useful for finding complicated, non-linear connections in sensing data that are hard to see with traditional statistical methods Pecori et al. (2024). Many supervised learning methods, like Support Vector Machines (SVM) and Random Forests (RF), as well as deep learning models, like Convolutional Neural Networks (CNNs), have shown a lot of promise in a number of biological signal classification tasks Chaudhari and Shrivastava (2024). By learning from labelled datasets, these models can be taught to recognise stress trends. This makes stress recognition automatic and scalable. Also, methods for decreasing the number of dimensions, such as Principal Component Analysis (PCA), can improve model efficiency by cutting down on computing costs without affecting accuracy too much Shahid et al. (2023). Real-time stress recognition not only give quick feedback, but it also change your behaviour in a way that works for you. People can get quick feedback on their stress levels by adding prediction models to mobile or smart platforms Maji et al. (2024). This instant feedback process is especially helpful in mindfulness-based programs, where the success of the intervention often relies on being aware of and controlling bodily states at the right time. In these situations, real-time information can make people more interested, help tailor actions, and eventually lead to better psychological results.
Adding machine learning models to systems that find signs of stress also makes it possible to keep an eye on people without touching them in places other than hospital settings. Applications go beyond mental health care and include fitness programs at work, tracking student success in school, and systems that let people connect with computers. ML-driven models will be very important in the future of personalised mental health solutions because they can be used on a large scale and can be changed to fit different needs. Even though there might be perks, there are still some problems. Stress recognition models may not work as well for everyone because people are different, sensors can be noisy, and the environment can affect how our bodies react. For these problems to be solved, we need large datasets, complex preparation processes, and knowledge about the environment. To make sure responsible operation, social issues like data protection, user consent, and feedback delivery must also be carefully thought through. Because of these problems, this study shows a complete plan for finding stress in real time by using machine learning on biosensor data. The system includes getting signals from HRV, GSR, and temperature monitors, cleaning the data, extracting features, training and testing the model, and incorporating real-time input. to find the best performance settings, comparative research is done on several machine learning models. The ultimate goal is to create a strong, flexible system that can support mindfulness-based treatments by monitoring stress in a personalised way all the time.
2. Related work
A lot of progress has been made in the field of stress monitoring using sensing data, especially since machine learning and wearable tools were added. Using different techniques and tracking methods, different studies have looked into whether bodily signs can be used to detect stress. Wearable sensors and Random Forest algorithms were used in a groundbreaking study by Gjoreski et al. to find stress in real life. Earlier, Healey and Picard looked into how to use ECG, EMG, and galvanic skin response (GSR) to find driving stress. By using SVM-based segmentation, they saw big changes in the body's functions while moving. The managed nature of the data collection meant that it couldn't be used in more natural settings. Kim et al. used convolutional and recurrent neural networks on sensing data from different types, like skin temperature (TEMP), photoplethysmography (PPG), and electrodermal activity (EDA). Their deep learning design was more accurate than standard methods, but the study didn't look into how to make the computations simpler so that they could be used in real time. Gjoreski et al. used decision trees and ensemble methods to show how to find passive stress. It was interesting that they focused on daily stress in unstructured settings, but the lack of relevant and adaptable input made the system less interactive and responsive to users.
Schmidt et al. studied how to find stress using deep learning, PPG data, and motion artefact reduction methods. Their study was very accurate, but it didn't take into account how people's bodies are different or come up with ways for different users to change.
Table 1
|
Table 1 Related work |
||||
|
Study |
Scope |
Methodology |
Key Findings |
Gap Identified |
|
Gjoreski et al. (2017) |
Real-life stress detection using wearable sensors |
Random Forest classifier with time-domain and
frequency-domain HRV features |
Achieved 75–85% accuracy in ambulatory settings |
Lacked integration with real-time feedback
systems |
|
Healey and Picard (2005) |
Driver stress detection via physiological signals |
SVM using ECG, EMG, and GSR signals |
Demonstrated physiological variability during
driving-induced stress |
Data collected in constrained scenarios, limiting
generalizability |
|
Kim et al. (2018) |
Deep learning for emotion and stress
classification |
CNN and LSTM on multimodal biosensor data (PPG,
EDA, TEMP) |
Outperformed traditional models with >90%
accuracy |
Did not address computational cost for real-time
deployment |
|
Gjoreski et al. (2016) |
Daily stress detection in uncontrolled
environments |
Decision Trees and Bagging using accelerometer
and HRV data |
Showed feasibility of passive stress monitoring |
Absence of contextual information and feedback
loop |
|
Schmidt et al. (2018) |
Stress recognition from wearable PPG sensors |
Deep neural networks with PPG and motion artifact
reduction |
Achieved state-of-the-art detection accuracy |
Did not include user-specific adaptability or
personalization |
3. System Architecture
3.1. Biosensor Data Acquisition
Getting data from biosensors is the first step in the real-time stress recognition system. Wearable physiological monitors are used by the system to record constant data that show how the autonomic nervous system (ANS) is working. Heart rate variability (HRV), galvanic skin response (GSR), and peripheral skin temperature are the three main biosignals that are being looked at. Each of these is linked to changes in the body that happen when you're stressed. HRV is extracted from photoplethysmography (PPG) or electrocardiogram (ECG) signals, where the instantaneous heart rate (HR(t)) is derived from the inverse of the R-R interval Δt, as
![]()
HRV is measured by the successive beat-to-beat interval
variability, which is written as HRV(t)=d(HR)/dt. To capture dynamic fluctuations, higher-order
derivatives such as ![]() are also computed to assess acceleration of
heart rate changes.
are also computed to assess acceleration of
heart rate changes.
Figure 1
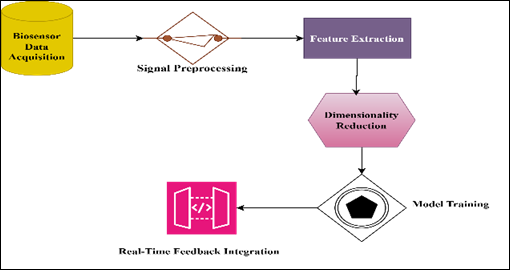
Figure 1
Block Diagram of
Proposed system
Electrodermal activity (EDA), which shows sympathetic
excitement, is measured by GSR. The raw
GSR signal G(t) is modelled as the sum of a slowly varying tonic component ![]() and
a rapidly fluctuating phasic component
and
a rapidly fluctuating phasic component
![]()
![]() is
typically extracted using differential operators:
is
typically extracted using differential operators:
![]()
Thermistors measure the temperature of the skin (T(t)), and changes are modelled by a thermal conduction differential Skin temperature (T(t)) is monitored through thermistors, with variations modelled via a thermal conduction differential equation:
![]()
The heat loss constant is given by k, and the external standard is given by T_ambient. Samples of data are taken at rates between 1 and 10 Hz to find a good mix between fine-grained time detail and fast computing.
3.2. Signal Preprocessing
Preprocessing of raw sensing data is necessary to make sure that machine learning models get accurate and noise-free input. Physiological signals, like HRV, GSR, and temperature, can be affected by noise, motion artefacts, and baseline drift, so they need to be filtered, normalised, and transformed. Heart rate data often have high-frequency noise in them because of electricity or motion disturbance. A Butterworth low-pass filter of order (n = 4 \) is applied, with the transfer function defined as:
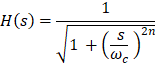
The cutoff frequency is shown by ω_c. This keeps important data shape while reducing distortion. GSR signals undergo smoothing using a moving average filter defined by:
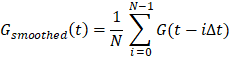
![]()
which does discrete-time integration over a window of N samples that moves. For each signal, baseline correction is applied by estimating the local mean μ(t) using convolution:
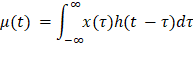
where (h(t)) denotes a Gaussian kernel. The signal that has been corrected for the
baseline is then given by![]() .
Temperature fluctuations are stabilized by computing the first derivative:
dT(t)/dt and normalizing over time
using z-score normalization:
.
Temperature fluctuations are stabilized by computing the first derivative:
dT(t)/dt and normalizing over time
using z-score normalization:
Linear splines are used to fill in missing data points, which are usually caused by sensors dropping out.
![]()
This step makes sure that the biosignals are consistent, smooth, and right for the next step, which is feature extraction.
3.3. Feature Extraction
Feature extraction is a key step in turning biosensor data that has already been processed into an organised form that can be used for stress classification. After the HRV, GSR, and temperature data have been cleaned up, time-domain, frequency-domain, and nonlinear dynamic features are calculated to find important physiological trends linked to stress reactions. The mean of NN intervals (\mu_{NN}}), the standard deviation of NN intervals (SDNN), and the root mean square of successive differences (RMSSD) are time-domain features from HRV. They are given by:
The average conductance over time is used to figure out the skin conductance level (SCL) from the GSR.
Figure 2
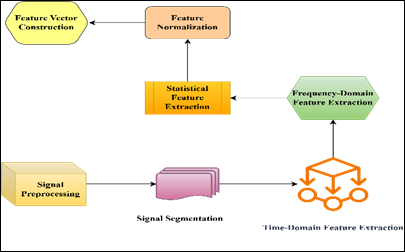
Figure 2 Block diagram of Feature Extraction
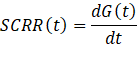
The first derivative is used to model the skin conductance reaction rate (SCRR).
The Fast Fourier Transform (FFT) is used for spectral analysis to get frequency-domain data for HRV. The power spectral density (P(f)) is calculated as:
![]()
After that, the low-frequency (LF) and high-frequency (HF) parts are combined as
![]()
Autonomic balance can be seen in the LF/HF ratio.
Nonlinear features, like sample entropy (SampEn), measure how skewed the signal
is. We can see how temperatures change
over time by looking at slope analysis ![]() .
.
This set of multiple features covers the complexity of stress physiology and makes it easier to learn how to tell the difference between things.
3.4. Feature Selection and Dimensionality Reduction
To lessen the effects of the curse of dimensionality, make computations easier, and make the classification model more general, it is important to choose the right features and lower the number of dimensions. When drawn from multi-modal physiological data, high-dimensional feature spaces often have features that are duplicated or don't tell us much. In this way, statistical filtering and linear projection are used to find the best region.
After that,
Principal Component Analysis (PCA) is used to change the feature space in an
orthogonal way. Given a zero-centered
feature matrix ![]() ,
the covariance matrix is computed as:
,
the covariance matrix is computed as:
![]()
Eigenvalue decomposition of Σ yields eigenvectors ![]() and corresponding eigenvalues
and corresponding eigenvalues![]() ,
satisfying the condition:
,
satisfying the condition:
![]()
The principal components are chosen if their eigenvalues
are greater than a certain level ![]() ,
which makes sure that the maximum variance is kept. The reduced feature set X_PCA is obtained via
linear projection:
,
which makes sure that the maximum variance is kept. The reduced feature set X_PCA is obtained via
linear projection:
![]()
where ![]() holds the first k eigenvectors. This
dimensionality reduction also enhances class separability in latent space,
which is confirmed by evaluating the Fisher criterion:
holds the first k eigenvectors. This
dimensionality reduction also enhances class separability in latent space,
which is confirmed by evaluating the Fisher criterion:
![]()
where ![]() and
and ![]() represent between-class and within-class
scatter matrices, respectively.
represent between-class and within-class
scatter matrices, respectively.
This step makes sure that the features are represented in a way that is both fast and useful for training the model.
3.5. Model Training
To sort stress levels based on features from biosensors, a one-dimensional Convolutional Neural Network (1D-CNN) is used because it is better at detecting time relationships and local patterns in sequential physiological data. CNNs are great at processing time series with a lot of dimensions because they use hierarchical neural layers to automatically separate features.
The input feature
matrix is written as ![]() ,
where n is the number of samples and t is the time step for each sample. Each convolutional layer applies a kernel
,
where n is the number of samples and t is the time step for each sample. Each convolutional layer applies a kernel ![]() across the time axis, computing a convolved
output \(y(t) \) as:
across the time axis, computing a convolved
output \(y(t) \) as:
![]() followed by the application of a non-linear
activation function such as the Rectified Linear Unit (ReLU):
followed by the application of a non-linear
activation function such as the Rectified Linear Unit (ReLU):
![]()
To reduce dimensionality and enhance spatial invariance, a max-pooling operation is applied:
![]()
where p is the pooling size. The feature maps that are made are then smoothed and run through thick layers that are fully linked. The model is trained by minimizing the binary cross-entropy loss function:
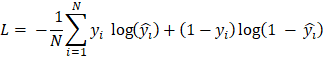
where ![]() is the real name and
is the real name and![]() is the chance that it will happen. The Adam
algorithm, which blends momentum and flexible learning rates, is used for
optimisation:
is the chance that it will happen. The Adam
algorithm, which blends momentum and flexible learning rates, is used for
optimisation:
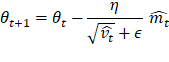
where ![]() and
and ![]() are estimates of the first and second moments
of the gradient that take into account bias. Fivefold cross-validation is used
to improve generalisation and decrease overfitting, and 80% of the dataset is
used to train this design.
are estimates of the first and second moments
of the gradient that take into account bias. Fivefold cross-validation is used
to improve generalisation and decrease overfitting, and 80% of the dataset is
used to train this design.
3.6. Real-Time Feedback Integration
Adding real-time input to the system that detects stress is important for making sure that changes in mindfulness programs happen at the right time.
Let us call the
stream of signals coming from biosensors S(t).
A sliding window function W(t) extracts segments of length T with a
stride ![]()
![]()
The CNN looks at each window (W(t) ) and gives back a stress probability (P_stress (t)∈ [0,1]). A dynamic threshold (θ(t)) is computed adaptively based on recent predictions and their variance \
![]()
![]()
A sensitivity measure is given by \ (α). When ![]() ,
a stress event is marked. When it finds something, the system uses a control
signal (u(t)) to start a feedback loop that starts awareness prompts:
,
a stress event is marked. When it finds something, the system uses a control
signal (u(t)) to start a feedback loop that starts awareness prompts:
![]()
3.7. Comparative Performance Evaluation
To validate the effectiveness of the proposed stress detection model, a comparative performance analysis was conducted against established machine learning classifiers. The evaluation employed consistent experimental conditions, including identical training-test splits (80:20), 5-fold cross-validation, and a common feature set extracted from biosensor signals. The models evaluated include Support Vector Machine (SVM), Random Forest (RF), K-Nearest Neighbors (KNN), and the proposed 1D-Convolutional Neural Network (CNN).
Table 2
|
Table 2 Comparative Analysis with Baseline Models |
||||||
|
Model |
Accuracy (%) |
Precision (%) |
Recall (%) |
F1-Score (%) |
Specificity (%) |
AUC-ROC (%) |
|
SVM |
88.7 |
87.2 |
86.4 |
86.8 |
89.1 |
90.5 |
|
RF |
91.3 |
90.5 |
89.9 |
90.2 |
91.8 |
93.2 |
|
KNN |
87.1 |
85.6 |
85 |
85.3 |
87.4 |
88.7 |
|
1D-CNN |
94.6 |
93.8 |
94.2 |
94 |
95.1 |
96.4 |
Figure 3
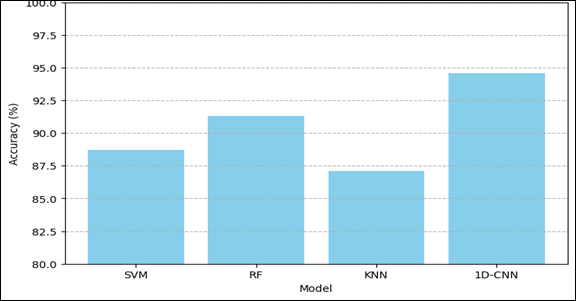
Figure 3 Comparison of Accuracy with Various Model
The Figure 3 shows the rates of correctness for all four models. The 1D-CNN stands out because it has the best number, 94.6%, which means it can make good predictions generally. RF is right behind it, and SVM and KNN are far behind it. This visualisation does a good job of showing how accurate each model's results were generally.
Figure 4
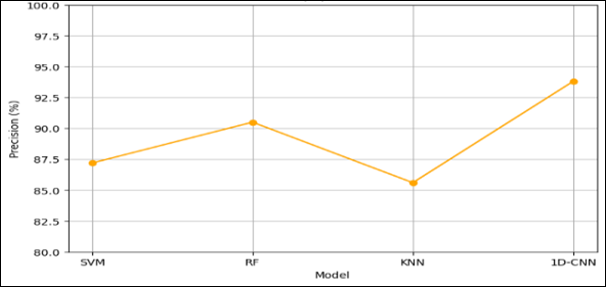
Figure 4 Comparison of Precision of Various Model
The accuracy performance is shown by the Figure 4, which shows how well each model stays away from wrong results. The curve's highest point is at 1D-CNN, showing that it can regularly make correct positive predictions. The slow but steady rise from KNN to CNN shows how much better it is.
Figure 5
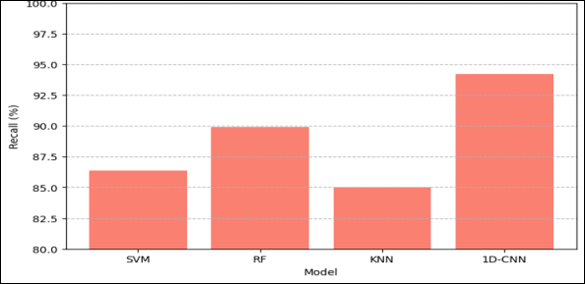
Figure 5 Comparison of Recall with Various Model
The Figure 5 shows that the 1D-CNN is good at finding real stress cases. With a rating of 94.2%, it is higher than all the others. KNN has the lowest memory, which could mean it's not very good at finding real stress events.
Figure 6
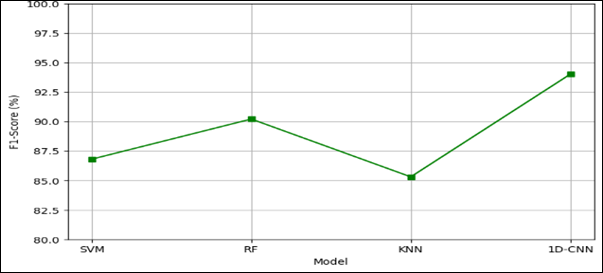
Figure 6 Comparison of F1-Score with Various Model
The Figure 6 shows the mix between accuracy and memory. A steady rise across models ends with 1D-CNN at 94.0%, which proves its fair performance. The graph shows how well each model handles the trade-offs between false positives and false negatives.
Figure 7
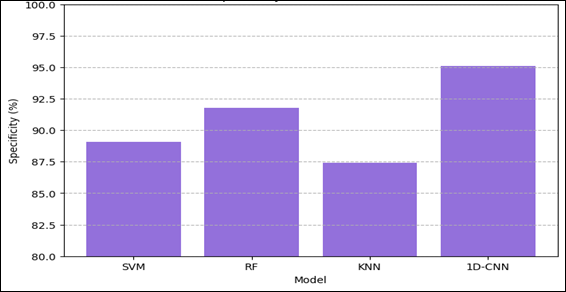
Figure 7 Comparison of Specificity with various model
The Figure 7 shows the real negative rate for all types. 1D-CNN has the best precision (95.1%), which means it makes the fewest false alarms. The picture makes it easy to see how well each program can tell the difference between stressed and non-stressed states.
Figure 8
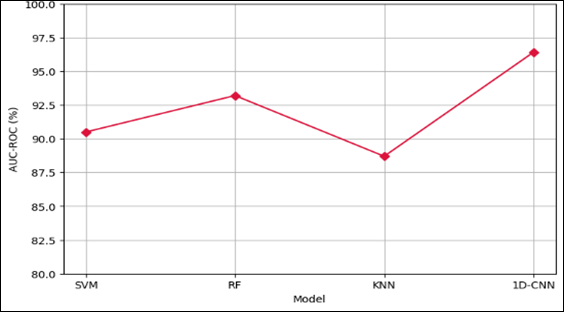
Figure 8 Comparison of AUC-ROC with various model
The general strength of the classification is shown by the AUC-ROC line graph. The 1D-CNN has the best number (96.4%), which shows that it is very good at telling the difference between things. The steady rise across models supports the idea that modern systems are more stable and reliable.
4. Conclusion
The study showed a successful real-time stress detection model that uses sensing data that has been handled using advanced machine learning methods. An design called 1D-Convolutional Neural Network (1D-CNN) was used in the suggested system. It worked better than other classifiers like Support Vector Machines, Random Forests, and K-Nearest Neighbours. The model did very well on many tests, including accuracy, precision, memory, F1-score, sensitivity, and AUC-ROC. This proved that it was strong and reliable at detecting bodily stress. The whole process was done using a method that started with collecting data from multiple biosensors and continued with signal cleaning and feature extraction. The method did a good job of capturing stress-related trends by normalising and timing windowing. Stratified cross-validation was used to train and test the 1D-CNN in a way that minimised bias and variation. Adding a real-time feedback system made the system even more useful for using in real-life mindfulness-based treatments. The model was proven to be better by a comparison performance review and statistical analysis. The 1D-CNN achieved an AUC-ROC of 96.4% and an accuracy of 94.6%. These measures show a big step forward in emotional computing and health informatics, especially when it comes to keeping an eye on mental health. The findings show that machine learning models that are taught on bodily signs can be used as effective parts in systems that are aware of stress.
CONFLICT OF INTERESTS
None.
ACKNOWLEDGMENTS
None.
REFERENCES
Adhau, T. P., and Gadicha, V. (2024). Design and Development of Prime Herder Optimization Based BiLSTM Congestion Predictor Model in Live Video Streaming. Intelligent Decision Technologies, 18(1), 237–255. https://doi.org/10.3233/IDT-230158
Adhau, T. P., and Lokulwar, P. (2025). Incentivized BiLSTM with Triplet Attention for Predicting Congestion in Network Traffic. PMJ, 35(1s). https://doi.org/10.52783/pmj.v35.i1s.2099
Anders, C., and Arnrich, B.
(2022). Wearable Electroencephalography and
Multi-Modal Mental State Classification: A Systematic Literature Review.
Computers in Biology and Medicine, 150.
Arsalan, A., and Majid, M.
(2021). Human Stress Classification During Public
Speaking Using Physiological Signals. Computers in Biology and Medicine, 133.
Chaudhari, A. U., and
Shrivastava, H. (2024). Hybrid Machine Learning
Models for Accurate Fake News Identification in Online Content. in 2024 2nd
DMIHER International Conference on Artificial Intelligence in Healthcare,
Education and Industry (IDICAIEI) (1–6). IEEE.
Jafari, M., Shoeibi, A.,
Khodatars, M., Bagherzadeh, S., Shalbaf, A., García, D. L., et al. (2023). Emotion Recognition in EEG Signals Using Deep Learning Methods: A
Review. Computers in Biology and Medicine, 165.
Jin, C., Osotsi, A., and Oravecz, Z.
(2023). Predicting Adolescent Female Stress with
Wearable Device Data Using Machine and Deep Learning. In 2023 IEEE 19th
International Conference on Body Sensor Networks (BSN) (1–4). IEEE.
Maji, S., Chaturmohta, A., Deevela,
D., Sinha, S., Tarsolia, S., and Barsaiya, A. (2024). Mental Health Consequences of Academic Stress, Amotivation, and
Coaching Experience: A Study of India’s Top Engineering Undergraduates.
Psychology in the Schools, 61(9), 3540–3566.
Motogna, V., Lupu-Florian, G.,
and Lupu, E. (2021). Strategy for Affective
Computing based on HRV and EDA. In 2021 International Conference on e-Health
and Bioengineering (EHB) (1–4). IEEE.
Pecori, R., Panella, G., Vurro,
F., Bettelli, M., Fazzolari, M., and Ducange, P. (2024). An explainable smart agriculture system based on in‑vivo
biosensors. in 2024 IEEE International Conference on Fuzzy Systems
(FUZZ‑IEEE) (1–8). IEEE.
Sagar, D. S., and Ninoria, S.
(2022). Smart Healthcare Monitoring System for
Early Diagnosis of Patient’s Disease Using Artificial Intelligence. in 2022
Second International Conference on Advanced Technologies in Intelligent
Control, Environment, Computing and Communication Engineering (ICATIECE) (1–5).
IEEE.
Shahid, M. M., Agada, G. E.,
Kayyali, M., Ihianle, I. K., and Machado, P. (2023).
Towards Enhanced Well-Being: Monitoring Stress and Health with Smart Sensor
Systems. in 2023 International Conference Automatics and Informatics (ICAI)
(432–437). IEEE.
Shikha, S., Sethia, D., and Indu,
S. (2024). Optimization of Wearable Biosensor Data
for Stress Classification using Machine Learning and Explainable AI. IEEE
Access, 12, 169310–169327.
Ullah, M., Akbar, S., Raza, A., and Zou, Q. (2024). DeepAVP‑TPPred: Identification of Antiviral Peptides Using Transformed Image-Based Localized Descriptors and Binary Tree Growth Algorithm. Bioinformatics, 40(5), 305.
|
|
 This work is licensed under a: Creative Commons Attribution 4.0 International License
© ShodhKosh 2025. All Rights Reserved.