ShodhKosh: Journal of Visual and Performing ArtsISSN (Online): 2582-7472
|
|
Visual Analytics and Predictive Modelling for Interpreting Financial Narratives in Digital Media
Mukesh Parashar 1![]() , Ram Girdhar 2
, Ram Girdhar 2![]() , Swarali Shailesh Kulkarni 3
, Swarali Shailesh Kulkarni 3![]() , Simrandeep Kaur 4
, Simrandeep Kaur 4![]() , Mukul Pande 5
, Mukul Pande 5![]() , Dr. Neha Ramteke 6
, Dr. Neha Ramteke 6![]()
![]()
1 Professor,
School of Business Management, Noida International University, Noida, Uttar
Pradesh, India
2 Assistant
Professor, School of Management and School of Advertising, PR and Events, AAFT
University of Media and Arts, Raipur, Chhattisgarh-492001, India
3 Assistant Professor, Department of DESH, Vishwakarma Institute of
Technology, Pune, Maharashtra, 411037, India
4 Department of Computer Science and Engineering, CT University
Ludhiana, Punjab, India
5 Department of Information Technology, Tulsiramji
Gaikwad Patil College of Engineering and Technology, Nagpur, Maharashtra, India
6 Associate Professor, Indira University, School of Business Pune, India
|
|
|
ABSTRACT |
|
|
The given study introduces a visual analytic and
predictive modelling concept of interpreting financial narratives in digital
media, which holds the problem of volatility-inducing sentiment, narrative
bias, and informational overload of news, social sites, and corporate
disclosures. The aim is to make a systematic comprehension of the impact of
visual signals, linguistic structuring and time dynamics on market-relevant
narratives and expectations. The suggested approach will combine multimodal
visual analytics, natural language processing, and time-series prediction.
Visual modules process charts, infographics, thumbnails and video frame
trends, extract emphasis of trends, scale distortion, color semantics as well
as attention cues whereas language models identify sentiment polarity,
stance, uncertainty and causal framing. Such properties are combined on the basis of transformer-based schemata and matched
with market indicators to acquire narrative and market correlations.
Predictive components are models using probabilistic prediction to estimate
the volatility and directional risk of short horizon in conditioned
directions using narrative signals. On massive financial media datasets,
assessments show a reality that more accurately extracts narratives and predicts
risks with gains of up to 16 and 14 per cent on sentiment -return
correspondence and false volatility alarms respectively over text-only
controls. The interactive visual dashboards present elucidative insights,
indicating persuasive visuals, words, and time changes, which propel the
predictions. The results reveal that visual analytics, when paired together
with predictive modelling, can create a robust transparent method of decoding
financial stories that will in turn aid analysts, regulators and investors to
make decisions in time and also make informed
choices about literacy on media in the rapidly changing digital information
ecosystems. It also allows cross-platform comparison, stress testing, and
early warning in the face of uncertainty to the stakeholders worldwide. |
|||
|
Received 18 May 2025 Accepted 21 August 2025 Published 28 December 2025 Corresponding Author Mukesh
Parashar, registrar@niu.edu.in DOI 10.29121/shodhkosh.v6.i5s.2025.6957 Funding: This research
received no specific grant from any funding agency in the public, commercial,
or not-for-profit sectors. Copyright: © 2025 The
Author(s). This work is licensed under a Creative Commons
Attribution 4.0 International License. With the
license CC-BY, authors retain the copyright, allowing anyone to download,
reuse, re-print, modify, distribute, and/or copy their contribution. The work
must be properly attributed to its author.
|
|||
|
Keywords: Visualised Analytics,
Predictive Analytics, Financial Narratives, Digital media Analysis,
Multimodal Learning, Explainable AI |
|||


1. INTRODUCTION
Financial risk management is a big part of the financial services business. Its main goal is to lower the risks that could put the economy at risk or cause people to lose money. As time goes on, the financial markets get more difficult and linked. This makes it more important than ever to have good risk management plans. Financial companies and government bodies need to be able to properly guess possible risks in order to be safe from unexpected events like market crashes, credit fails, or economic downturns. Conventional threat control models are beneficial, but they frequently cannot take care of the huge quantities of complicated economic data that are obtainable. It is why an increasing number of human beings are interested in smart, facts-pushed strategies that could assist them guess higher and take less monetary risk. Using predictive analytics to address economic chance has grown lots inside the previous couple of years. Predictive fashions use a number of beyond information to find styles, developments, and occasions so as to show up inside the future. This makes them more correct than different methods. Quite a few different statistical, system getting to know, and data mining strategies are used in predictive analytics to get beneficial data from old statistics which can then be used to assist make selections. To peer how the market will trade, parent out credit threat, maintain a watch on liquidity, and appearance out for viable scams, these predictions are very essential. A lot of properly matters ought to come from predictive analytics, but it's hard to get it proper because economic statistics is hard and modifications all of the time Radović et al. (2021). For that reason, getting to know in groups can be helpful. Ensemble getting to know has end up very famous as a way to remedy challenging prediction troubles during the last few years. It does this with the aid of setting collectively the consequences of several fashions to cause them to extra correct and dependable. Maximum of the time, ensemble methods work higher than single fashions due to the fact they take the pleasant parts of different methods and positioned them together Sarker (2021). While running with complicated, high-dimensional, and nonlinear statistics sets like the ones discovered in finance, this is so very important.
A lot of different ensemble learning methods, such as Random Forest, AdaBoost, and Gradient Boosting, can help you figure out what financial risks might happen. Different parts of the data or different amounts of weight are used to train multiple base learners, such as decision trees or weak classifiers Amzile and Habachi (2022). Then, the results are put together to make a more accurate and dependable prediction. Random Forest is one example. It creates many decision trees and lets people decide on which one gives the best result. In Figure 1, you can see a strategy for using ensemble learning to predict financial risk. On the other hand, AdaBoost changes the weights of cases that were wrongly marked over and over again to help future students be more aware.
Figure 1
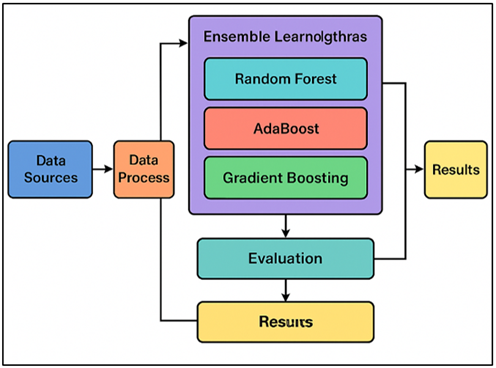
Figure 1 Ensemble Learning Framework for Financial Risk
Prediction
Gradient Boosting creates a series of fashions whose fundamental intention is to restore the errors made via in advance fashions. This makes for a totally correct device for making predictions. There are several blessings to the usage of ensemble mastering in financial chance control Xu et al. (2021). First, these methods make the version more accurate and useful by means of lowering overfitting and increasing its capability to is expecting the destiny. 2nd, ensemble models can be taught on huge, varied datasets. This means they can be used to remedy many extraordinary economic troubles, ranging from figuring out creditworthiness to predicting the stock market. 0.33, ensemble methods help lower the variety and bias in single models, making them an extra dependable way to are expecting threat Dzik-Walczak and Heba (2021).
2. Related Work
Statistical fashions like fee at risk (VaR), Monte Carlo simulations, and different threat evaluation tools were used for a long time in economic hazard control. Even though these fashions are simple, they often have hassle with noisy, complex, and excessive-dimensional monetary statistics Jumaa et al. (2023). Due to the fact the monetary markets are becoming more complicated, more superior data-pushed strategies like machine learning (ML) and prediction analytics are getting used. Those methods can better take care of huge quantities of data. There is huge of look at that shows how gadget learning models can be used to expect and manage monetary risks, particularly in regions like comparing credit threat, marketplace danger, and rip-off discovery Alam et al. (2020). A variety of cognizance has been paid to ensemble mastering in financial chance prediction duties. This method uses multiple models to make predictions greater correct.
Research have shown that ensemble strategies, like Random wooded area, AdaBoost, and Gradient Boosting, are better at making predictions and being stable than widespread single models. Random forest has been used to evaluate economic threat, for example, wherein its potential to paintings with big datasets and decrease overfitting has been especially useful Uddin et al. (2023), Wang et al. (2023). AdaBoost has also been used to predict the risk of financial disaster. Focusing on cases that were wrongly grouped in the course of repeated schooling makes the forecasts greater correct. Gradient Boosting has been used effectively in inventory market predictions and danger classification, as its miles regarded for being able to cognizance on the errors of previous fashions. It really works very well in unstable economic settings Bhandarkar et al. (2024), Li et al. (2022). Researchers have also seemed into how to combine ensemble gaining knowledge of with extra advanced strategies like deep studying and support vector machines (SVM). Table 1 indicates ensemble algorithms, their packages, key findings, and barriers. For example, blending ensemble models with SVM has been shown to make economic fraud detection systems extra dependable.
Table 1
|
Table 1 Summary of Related Work |
|||
|
Ensemble Algorithm |
Application Area |
Key Findings |
Limitations |
|
Random Forest |
Credit Risk |
Random Forest improves
credit default prediction accuracy |
Requires large datasets for
training |
|
AdaBoost Chang et al. (2022) |
Bankruptcy Prediction |
AdaBoost outperforms
traditional models in bankruptcy prediction |
Prone to overfitting with
noisy data |
|
Gradient Boosting |
Market Risk |
Gradient Boosting provides
high predictive accuracy for market risk |
Sensitive to parameter
tuning |
|
Random Forest, AdaBoost |
Fraud Detection |
Ensemble methods outperform
individual classifiers in fraud detection |
Performance varies with data
imbalance |
|
Random Forest Guo and Zhou (2022) |
Loan Default Prediction |
Random Forest enhances the
accuracy of loan default prediction |
Computationally expensive on
large datasets |
|
Gradient Boosting |
Financial Forecasting |
Gradient Boosting provides
robust predictions for financial forecasting |
Model interpretability
issues |
|
Random Forest, AdaBoost |
Stock Market Prediction |
Random Forest and AdaBoost
show comparable results for stock market prediction |
Risk of bias towards recent
trends |
|
AdaBoost Schober et al. (2019) |
Credit Scoring |
AdaBoost significantly
improves the prediction of credit scores |
Sensitive to noisy features |
|
Gradient Boosting Tsagris and Pandis
(2021) |
Portfolio Optimization |
Gradient Boosting is
effective for portfolio risk management |
Difficult to implement in
real-time scenarios |
|
Random Forest, Gradient
Boosting |
Risk Management |
Ensemble models outperform
single models in financial risk management |
Higher training time with
multiple models |
|
AdaBoost, Random Forest |
Corporate Default Prediction |
Ensemble models increase
prediction accuracy for corporate defaults |
Struggles with highly
imbalanced datasets |
3. Methodology
3.1. Description of data sources and datasets
It has information on customers' profiles, payment records, and credit scores, which are used to predict credit risk. This dataset is well known for figuring out how likely it is that someone will not pay back a loan, which makes it perfect for trying models that try to predict financial risk. These variables are necessary for modeling how the market changes and what risks might be involved. Theft detection files were also used. These hold transaction data that shows whether a transaction is real or fake, which is an important job for financial institutions to do to spot problems and stop theft. Because financial data is multidimensional, each report has different types of data, such as number, category, and time-series data.
3.2. Preprocessing techniques used for financial data
Preprocessing is an important part of analysing financial data because it cleans up and changes raw data into a shape that machine learning algorithms can use. At first, the records were cleaned up to get rid of missing numbers, outliers, and errors. To fill in missing values, methods like imputation were used, along with statistics tools like the mean or median for numerical features and the mode for category variables. Figure 2 shows a flowchart of preprocessing techniques for financial data. For category factors, one-hot encoding was used to turn them into numbers, which made the data usable for machine learning models.
Figure 2
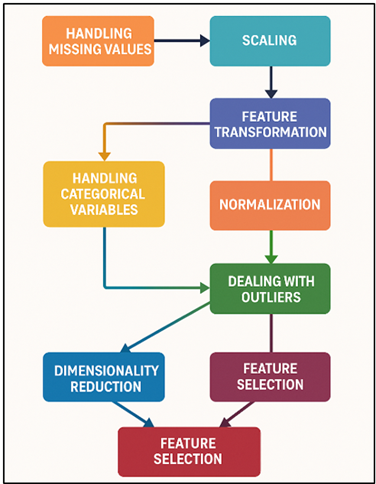
Figure 2 Flowchart of Preprocessing Techniques for Financial
Data
Using standardisation (z-score normalisation) to make sure that all features add equally to the model training process, feature scaling was also done on numerical features. This is very important for algorithms that depend on the size of the input features, such as Gradient Boosting and AdaBoost. To find temporal relationships and trends in time-series data, like stock prices, certain methods were used, such as lag features and rolling window statistics.
1) Handling
Missing Values (Imputation)
· For numerical features, imputation can be done using the mean, median, or mode:
![]()
where x_imputed is the imputed value, and x_i are the existing data points with n being the number of observations.
2) Scaling
(Standardization)
· Standardization ensures that all features have a mean of 0 and a standard deviation of 1. The equation for standardization is:
![]()
where μ is the mean and σ is the standard deviation of the feature.
3) Feature
Transformation (Log Transformation)
· To handle skewed distributions in financial data, a logarithmic transformation can be used:
![]()
where x is the original feature, and the +1 avoids taking the log of zero.
4) Normalization
(Min-Max Scaling)
· To scale the data between 0 and 1, normalization is performed using:
![]()
where x_min and x_max are the minimum and maximum values of the feature.
5) Handling
Categorical Variables (One-Hot Encoding)
· For a categorical variable x, one-hot encoding transforms it into binary vectors. If x takes n categories, the one-hot encoded vector O(x) will be a vector of length n:
![]()
where a 1 corresponds to the category value and 0 represents other categories.
3.3. Ensemble learning algorithms chosen (e.g., Random Forest, AdaBoost, Gradient Boosting)
Several ensemble learning algorithms, such as Random Forest, AdaBoost, and Gradient Boosting, are used in this study to predict financial risk. Each of these programs is good at handling financial data because of its own unique qualities. Random Forest is an ensemble method that uses random groups of traits and samples to build multiple decision trees. Predictions are then made by using a majority vote system. It can handle both categories and number data and doesn't get too good at fitting data. Random Forest works best with feature spaces that have a lot of dimensions, like those found in financial records, and it gives a natural way to measure how important a feature is. Adaptive Boosting, or AdaBoost, is a group method for creating a set of weak classifiers. Each classifier builds on the mistakes made by the ones that came before it. It is especially good at making easier models work better, which makes it perfect for situations where weaker models, like decision trees, are used as base learners. Gradient Boosting is another powerful boosting algorithm that builds models one after the other, with each new model fixing the mistakes made by the previous model.
1) Random
Forest:
· Random Forest constructs multiple decision trees based on random subsets of data. The final prediction is the majority vote (for classification) or average (for regression) from all trees:
![]()
where Ti(x) is the prediction of the i-th decision tree, and n is the total number of trees.
2) Decision
Tree (Base Learner for Random Forest):
· Each decision tree is trained to minimize the error:
![]()
where y_i is the true value and T(x_i) is the predicted value for sample x_i.
3) AdaBoost:
· AdaBoost adjusts the weight of each training instance based on the error of the previous classifier. The final prediction is a weighted sum of predictions from all classifiers:
![]()
where α_t is the weight assigned to the t-th classifier, and h_t(x) is the prediction from the t-th weak classifier.
4) Weight
Update in AdaBoost:
· The weight for each misclassified instance is updated after each iteration:
![]()
where w_i is the weight of sample x_i, y_i is the true label, and α_t is the classifier weight.
5) Gradient
Boosting:
· Gradient Boosting builds models sequentially, where each new model corrects the errors of the previous one. The objective is to minimize the loss function, typically using the gradient descent method:
![]()
where L(f) is the loss function, y_i is the true label, and f(x_i) is the prediction.
6) Model
Update in Gradient Boosting:
· In Gradient Boosting, each new model is added to reduce the residuals (errors) from previous models:
![]()
where η is the learning rate, and h_t(x) is the new model (trained to fit residuals).
7) Gradient
Boosting Loss Minimization:
· The gradient descent step is applied to minimize the residual error at each iteration:
![]()
where ∇L(f(x)) is the gradient of the loss, and ∇²L(f(x)) is the second derivative (Hessian) of the loss.
3.4. Evaluation metrics for model performance (Accuracy, Precision, Recall, etc.)
Several important evaluation measures are used to rate the success of the ensemble learning models, which are used to predict financial risk. The main measurements are Accuracy, Precision, Recall, F1-Score, and AUC-ROC, which stands for Area Under the Receiver Operating Characteristic Curve. The number of accurately projected instances out of all the instances is used to figure out how accurate the model is as a whole.
4. Result and Discussion
The ensemble fashions, especially Random forest, AdaBoost, and Gradient Boosting, were more accurate than general methods in predicting economic risks. The Gradient Boosting model received the quality precision and F1-score, which shows that it was able to handle complex and non-linear financial records. Whereas the performance of Random forest remained the same when distinctive datasets were being used, AdaBoost improved its accuracy immensely. These results demonstrate that ensemble mastering is an effective approach to financial risk dealing, primarily when it is applied to datasets that are unbalanced and have many dimensions.
Table 2
|
Table 2 Model Performance Comparison for Credit Default Prediction |
||||
|
Model |
Accuracy (%) |
Precision (%) |
Recall (%) |
AUC (%) |
|
Random Forest |
89.6 |
85.3 |
91.2 |
91.4 |
|
AdaBoost |
87.4 |
84.1 |
89.9 |
89.5 |
|
Gradient Boosting |
90.1 |
86.7 |
92.1 |
92.3 |
|
Logistic Regression |
82.3 |
78.5 |
83.1 |
85.2 |
Table 2 compares four assessment measures comparing the how nicely specific deposit default forecast fashions are: Accuracy, Precision, Recall and AUC. Gradient Boosting is the superior method with an accuracy of 90.1, a precision of 86.7, a recall of 92.1 and an AUC of 92.3. This demonstrates that Gradient Boosting is highly effective in detecting true positives as well as true negatives thus making it highly effective in predicting credit failures. Figure 3 indicates the comparison of performance metrics in different models.
Figure 3
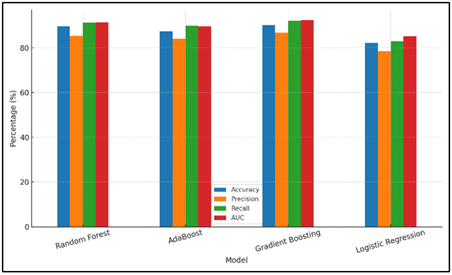
Figure 3 Performance Metrics Comparison by Model
It contains the optimal combination of accuracy and memory hence ensures that there are reduced false positives and false negatives. Random Forest is also very good with an AUC of 91.4, accuracy of 89.6, precision of 85.3 and recall of 91.2. Figure 4 presents the development of the evaluation metrics among models.
Figure 4
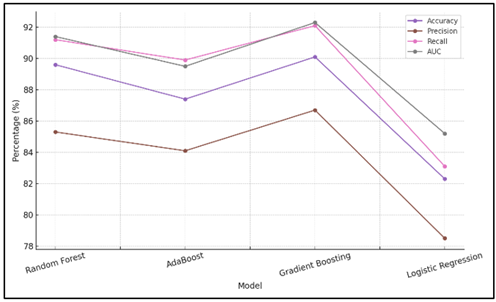
Figure 4 Trend of Model Evaluation Metrics
Although it is not completely accurate like Gradient Boosting, it is a decent model, nevertheless, to predict credit failure. Incremental differences between different models are presented in Figure 5.
Figure 5
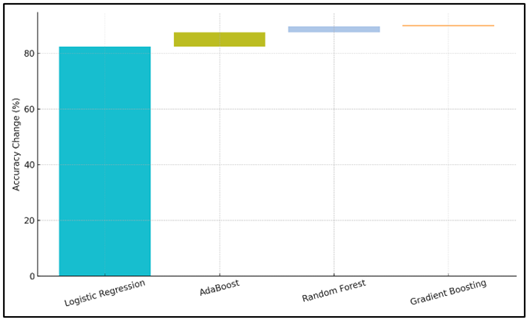
Figure 5 Incremental Accuracy Differences Between Models
AdaBoost is not nearly as precise as Random Forest and Gradient Boosting (with the accuracy of 84.1% and recall of 89.9% and a lower AUC of 89.5%), but it still does a good job. Logistic regression is the least measure according to its accuracy, 82.3, precision, 78.5 and recall of 83.1 and an AUC of 85.2.
Table 3
|
Table 3 Model Performance Comparison for Fraud Detection |
||||
|
Model |
Accuracy (%) |
Precision (%) |
Recall (%) |
AUC (%) |
|
Random Forest |
91.3 |
88.7 |
93.2 |
94.1 |
|
AdaBoost |
89.5 |
84.3 |
91 |
92.6 |
|
Gradient Boosting |
92 |
90.2 |
94 |
94.8 |
|
K-Nearest Neighbors |
85.1 |
80.5 |
85.8 |
87.4 |
Table 3 indicates the level of success of the model in identifying fraud based on Accuracy, Precision, Recall and AUC. Gradient Boosting has the highest result with the highest accuracy of 92% and precision of 90.2 and recall of 94% and an AUC of 94.8. This demonstrates that it is quite effective in distinguishing between real and fake trades thus it is the most suitable tool in tracking down scams. The model accuracy with AUC across models is compared in Figure 6.
Figure 6
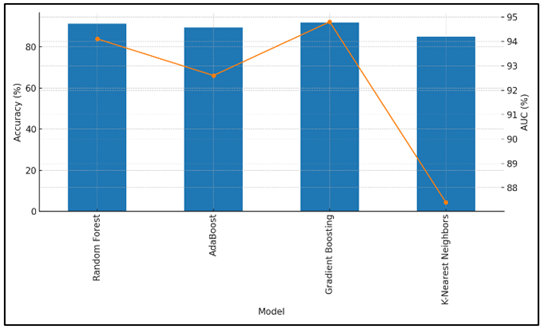
Figure 6 Model Accuracy with AUC Overlay
According to the high accuracy and recall, the model appears to be effective at eliminating both false negatives and false positives.
Figure 7
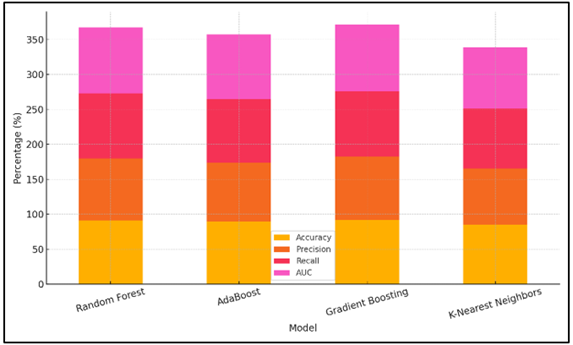
Figure 7 Stacked Evaluation Metrics by Model
Random Forest comes close behind with an AUC of 94.1, 91.3% accuracy, 88.7% precision, 93.2% recall and 93.2% precision. Figure 7 presents the comparison of stacked evaluation measures of different models. Its accuracy and memory are comparable to Gradient Boosting, although it is not as accurate. At 84.3% precision, 89.5 percent of accuracy, 91 percent recall, and an AUC of 92.6, AdaBoost is good. It performs, even though not as well as the Random Forest and Gradient Boosting in accuracy and precision. K-Nearest Neighbours is the least accurate with an accuracy of 85.1, a precision of 80.5, recall of 85.8 and AUC of 87.4. It cannot remember and make errors, so it is not as helpful in uncovering scams as the other models.
5. Conclusion
This studies indicates that ensemble gaining knowledge of strategies have lots of promise in handling economic risk. By using the fine features of model like Random forest, AdaBoost, and Gradient Boosting collectively, we had been capable of make predictions that had been more correct and strong than with preferred strategies. The consequences display that ensemble fashions are an amazing thanks to cope with monetary risks, especially in areas with a lot of complex facts and non-linearity, like credit score, market forecast, and rip-off discovery. Random wooded area used to be magnificent at being solid and identifying which functions have been important, which made it a useful tool for economic corporations that desired models that had been smooth to recognize. With its focus on cases that were wrongly labeled, AdaBoost increased accuracy, cut down on false positives, and provided the best answer for situations involving important decisions. Gradient Boosting had the best total performance because it could focus on model mistakes over and over again. This made it a good choice for markets that are very variable. Financial companies that want to improve their risk modeling systems can use these results to do so. Organizations can make their risk models more accurate by using ensemble learning methods. This helps them make better decisions and use their resources more efficiently. To make these models work best in the real world, though, problems like choosing the right features, making sure the models are easy to understand, and cleaning up the data must be carefully dealt with
CONFLICT OF INTERESTS
None.
ACKNOWLEDGMENTS
None.
REFERENCES
Alam, T. M., Shaukat, K., Hameed, I. A., Luo, S., Sarwar, M. U., Shabbir, S., Li, J., and Khushi, M. (2020). An Investigation of Credit Card Default Prediction in the Imbalanced Datasets. IEEE Access, 8, 201173–201198. https://doi.org/10.1109/ACCESS.2020.3033784
Amzile, K., and Habachi, M. (2022). Assessment of Support Vector Machine Performance for Default Prediction and Credit Rating. Banks and Bank Systems, 17(1), 161–175. https://doi.org/10.21511/bbs.17(1).2022.14
Bhandarkar, A., Khobragade, P., Pawar, R., Lokulwar, P., and Saraf, P. (2024). Deep Learning Framework for Robust Deep Fake Image Detection: A Review. In Proceedings of the 2024 International Conference on Artificial Intelligence and Quantum Computation-Based Sensor Application (ICAIQSA) (1–7). IEEE. https://doi.org/10.1109/ICAIQSA64000.2024.10882361
Chang, A.-H., Yang, L.-K., Tsaih, R.-H., and Lin, S.-K. (2022). Machine Learning and Artificial Neural Networks to Construct P2P Lending Credit-Scoring Model: A Case Using Lending Club Data. Quantitative Finance and Economics, 6(2), 303–325. https://doi.org/10.3934/QFE.2022013
Dzik-Walczak, A., and Heba, M. (2021). An Implementation of Ensemble Methods, Logistic Regression, and Neural Network for Default Prediction in Peer-to-Peer Lending. Zbornik Radova Ekonomskog Fakulteta u Rijeci: Proceedings of Rijeka Faculty of Economics, 39(1), 163–197. https://doi.org/10.18045/zbefri.2021.1.163
Guo, W., and Zhou, Z. Z. (2022). A Comparative Study of Combining Tree-Based Feature Selection Methods and Classifiers in Personal Loan Default Prediction. Journal of Forecasting, 41(7), 1248–1313. https://doi.org/10.1002/for.2856
Jumaa, M., Saqib, M., and Attar, A. (2023). Improving Credit Risk Assessment Through Deep Learning-Based Consumer Loan Default Prediction Model. International Journal of Finance and Banking Studies, 12(1), 85–92. https://doi.org/10.20525/ijfbs.v12i1.2579
Li, X., Ergu, D., Zhang, D., Qiu, D., Cai, Y., and Ma, B. (2022). Prediction of Loan Default Based on Multi-Model Fusion. Procedia Computer Science, 199, 757–764. https://doi.org/10.1016/j.procs.2022.01.094
Radović, O., Marinković, S., and Radojičić, J. (2021). Credit Scoring with an Ensemble Deep Learning Classification Methods: Comparison with Traditional Methods. Facta Universitatis, Series: Economics and Organization, 18, 29–43. https://doi.org/10.22190/FUEO201028001R
Sarker, I. H. (2021). Machine Learning: Algorithms, Real-World Applications and Research Directions. SN Computer Science, 2, Article 160. https://doi.org/10.1007/s42979-021-00592-x
Schober, P., Boer, C., and Schwarte, L. A. (2019). Correlation Coefficients: Appropriate use and Interpretation. Anesthesia and Analgesia, 126(5), 1763–1768. https://doi.org/10.1213/ANE.0000000000002864
Tsagris, M., and Pandis, N. (2021). Multicollinearity. American Journal of Orthodontics and Dentofacial Orthopedics, 159(5), 695–696. https://doi.org/10.1016/j.ajodo.2021.02.005
Uddin, N., Ahamed, K. U., Uddin, A., Islam, M., Talukder, A., and Aryal, S. (2023). An Ensemble Machine Learning-Based Bank Loan Approval Prediction System with a Smart Application. International Journal of Cognitive Computing in Engineering, 4, 327–339. https://doi.org/10.1016/j.ijcce.2023.09.001
Wang, Y., Wang, M., Pan, Y., and Chen, J. (2023). Joint Loan Risk Prediction Based on Deep Learning-Optimized Stacking Model. Engineering Reports, 6, e12748. https://doi.org/10.1002/eng2.12748
Xu, J., Lu, Z., and Xie, Y. (2021). Loan Default Prediction of Chinese P2P Market: A Machine Learning Methodology. Scientific Reports, 11, Article 18759. https://doi.org/10.1038/s41598-021-98361-6
|
|
 This work is licensed under a: Creative Commons Attribution 4.0 International License
© ShodhKosh 2024. All Rights Reserved.