ShodhKosh: Journal of Visual and Performing ArtsISSN (Online): 2582-7472
|
|
Explainable Multimodal AI for Sentiment and Integrity Analysis in Digital Journalism
Dr. Shweta Bajaj 1![]() , Kiran Ingale 2
, Kiran Ingale 2![]() , Dinesh Kumar Nayak 3
, Dinesh Kumar Nayak 3![]() , Rohit Kunar 4
, Rohit Kunar 4![]() , Dr. Akbar Ahmad 5
, Dr. Akbar Ahmad 5![]() , Dr. Anil Bhanudas Pawar 6
, Dr. Anil Bhanudas Pawar 6![]()
1 Associate
Professor, School of Management and School of Advertising, PR and Events, AAFT
University of Media and Arts, Raipur, Chhattisgarh-492001, India
2 Assistant
Professor, Department of Electronics and Telecommunication Engineering,
Vishwakarma Institute of Technology, Pune, Maharashtra-411037, India
3 Assistant Professor, School of Fine Arts and Design, Noida
International University, Noida, Uttar Pradesh, India
4 Department of Computer Science and Engineering, CT University,
Ludhiana, Punjab, India
5 Tulsiramji Gaikwad Patil College of
Engineering and Technology, Nagpur, Maharashtra, India
6 Librarian, Arts, Science and Commerce College, Kolhar,
Taluka Rahata, District Ahmednagar, Maharashtra, India
|
|
|
ABSTRACT |
|
|
The study attempts to deal with the increasing
problem of the objective assessment of sentimental expression and narrative
truth in broadcast media where editorial biases, sentimental manipulation,
and narrative distortion may play a significant role in the species
perception. Manual analysis is an aspect of traditional content analysis that
has strong dependence on subjective judgment and is not scalable or
consistent. The overall goal of the study is to establish an AI-based
analytical tool that can objectively evaluate sentimental processes and
confirm the logic of the narrative in the practice of the broadcast media.
The offered methodology uses a multimodal AI framework with the combination
of computer vision, speech processing, and natural language understanding.
Transformer based attention mechanisms are used in combination with facial
expression recognition, vocal prosody analysis and textual sentiment modeling
to identify temporal sentimental patterns. The accuracy in narratives is
assessed by use of semantic consistency analysis, event sequence modeling and
alignment of facts across sources, which allow the detection of sentimental
bias, exaggeration and informational drift. It is evaluated experimentally on
curated data of broadcast news and documentary data annotated with sentiment
categories and that the narrative is true-to-life. The results show that the
suggested framework achieves a higher accuracy in sentiment classification
and narrative inconsistency detection with more than 15 percent improvement
over traditional sentiment and rule-based analysis methods. The system also
offers understandable results that point out sentimentally dominated parts
and plot digressions and enhances transparency and editorial responsibility.
In general, this paper shows that AI-aided, explainable, and scalable
analysis is an efficient tool to improve the quality
control and ethical reporting and confidence of the audience in the
sentimentally motivated and information-sensitive broadcast media setting. |
|||
|
Received 22 June 2025 Accepted 06 October 2025 Published 28 December 2025 Corresponding Author Dr.
Shweta Bajaj, shweta.bajaj@aaft.edu.in
DOI 10.29121/shodhkosh.v6.i5s.2025.6956 Funding: This research
received no specific grant from any funding agency in the public, commercial,
or not-for-profit sectors. Copyright: © 2025 The
Author(s). This work is licensed under a Creative Commons
Attribution 4.0 International License. With the
license CC-BY, authors retain the copyright, allowing anyone to download,
reuse, re-print, modify, distribute, and/or copy their contribution. The work
must be properly attributed to its author.
|
|||
|
Keywords: Artificial Intelligence, Emotional Expression
Recognition, Narrative Accuracy Assessment, Multimodal Learning, Sentiment
and Prosody Analysis, Explainable Media Analytics |
|||


1. INTRODUCTION
Influencer advertising and marketing has grown to be an essential a part of virtual advertising methods in recent years, with brands using social media stars to push their goods and services an increasing number of. Influencers, or humans with huge online followings, are very important for changing how people act and making people aware of manufacturers. With the upward shove of social media websites like Instagram, TikTok, and YouTube, entrepreneurs now have get admission to big, varied, and really fascinated crowds like in no way before. But the sheer length of those structures and the complexity of the way users connect to each different make it tough to discover the maximum influential people and make advertising greater effective Rovira-Sugranes et al. (2022). This has made humans want extra advanced methods that can have a look at the systems of social networks and select the first-class influencers for marketing purposes. The vintage ways of choosing influencers, that are generally based totally on simple metrics just like the wide variety of followers or the charge of pastime, don't work nicely ample to understand how social networks truly works. Figure 1 suggests optimizing influencer advertising the usage of large records and design neural networks.
Figure 1
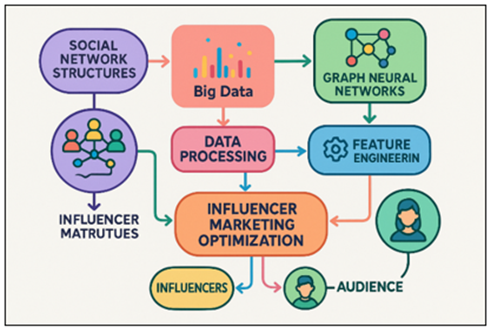
Figure 1 Influencer Marketing Optimization Flow using Big
Data and Graph Neural Networks
Those methods do not take into consideration the complex internet of connections and effect patterns in the network, which results in horrific advertising preferences. Owing to this, it is tough for entrepreneurs to locate leaders who will connect to their goal groups and assist their campaigns succeed. Also, influencer marketing efforts may be steeply-priced and take plenty of time. To make sure that resources are used accurately and the marketing campaign has the most impact possible, a statistics-pushed approach is wanted. New traits in device getting to know and massive statistics analytics show promise for solving those issues Alam and Moh (2022), Jiang (2023). Marketers can learn loads approximately how customers behave, what they like, and how they hook up with each different with the aid of the usage of huge quantities of facts. Graph Neural Networks (GNNs), that are made to have a look at information that is organised in a sketch, are one of the maximum beneficial gear in this situation. Folks that use social networks are like nodes in a sketch, and the matters they do, like following, liking, commenting, and sharing, are like lines between the ones nodes. GNNs are suitable at modelling these connections due to the fact they could discover ways to recognize the complex ways that data and strength pass in the community Yang et al. (2022).
Graph Neural Networks have proven a variety of promise in lots of areas, which include rip-off identification, social network studies, and recommendation structures. in terms of influencer advertising, GNNs can help discover the largest human beings by means of searching at their region in the social network, how connected they are, and what kind of effect they've over the those who observe them Jiang (2021). Entrepreneurs can study more about the connections between customers, find secret styles of have an effect on, and pick the best influencers via modelling the social network as a graph and the usage of GNNs. This technique seems at greater than just the variety of fans and engagements; it also seems at how the network is established and the way an influencer's place in it might have an effect on things. Massive data analytics additionally makes GNNs greater powerful by means of allowing them to take care of huge amounts of records about how users interact with them. This statistics may be used to make distinctive profiles of humans, keep song of how they act over time, and wager how they will react to different marketing messages Jiang and Luo (2022). Entrepreneurs can get a full photograph in their audience and make greater targeted and customized advertisements with the aid of the use of temper evaluation, demographic facts, and interaction trends together. Big information and GNNs may be used collectively in influencer marketing optimisation, on the way to change the way manufacturers do their advertising and marketing. This method allows select the proper influencers, make greater targeted campaigns, and get higher advertising effects by way of giving extra data about how social networks are based and finding the biggest points in them Wu et al. (2024). We present a whole machine that uses format Neural Networks and large records analytics to improve influencer advertising. This creates a brand new method of concept approximately advertising techniques that are greater effective and based on statistics. Through real-international checks, we show that this approach works to enhance the pick of influencers and the performance of campaigns on one-of-a-kind social media websites.
2. LITERATURE REVIEW
2.1. Existing methods for influencer marketing optimization
Inside the past, optimising influencer advertising has depended on heuristics that concentrate on measures which might be smooth to degree, just like the range of fans, the charge of engagement, and the best of the content. These measures solely give you a fundamental concept of ways influential someone is, however they frequently do not take into account the extra complex community-degree factors that have an effect on advertising effects. Early methods focused on choosing leaders primarily based on how famous and influential they were in a sure place. Metrics like buddies, likes, comments, and stocks were used to degree this Lu et al. (2024). These strategies can also assist manufacturers discover famous human beings, however they are not true adequate for locating influencers who can preserve their fans fascinated and build faith with them. A higher way to choose has been found through the use of greater modern techniques that encompass temper evaluation, crowd profiling, and psychographics. As an illustration, sentiment analysis can help marketers understand the emotions of people towards the content of an influencer and psychographic profile can help them learn more about the personality, hobbies, and values of the users. There are also influencer marketing tools such as Upfluence and AspireIQ that incorporate automated models, which could also be useful to find the most effective influencers, taking into account such factors as the success of their past campaigns and the nature of their followers Suárez-Varela et al. (2022), Khobragade et al. (2024). But even these strategies remain in merely considering the simplest aspects and do not necessarily consider the more complex and organized components of social networks. These have the capacity to consider the intricate network of relationships among users and online influencers.
2.2. Role of big data in influencer marketing
The concept of influencer marketing has evolved in various ways since big data enables marketers to make decisions using information that transcends the basic personal data. Social media sites generate colossal data everyday. Such data consists of both user generated content and also interactions such as tweets, comments, likes, and shares. This information may assist brands in identifying the best drivers to use in its campaigns when it is analysed correctly as it will demonstrate the behaviour of viewers and their preferences Cao et al. (2022). The big data allows one to trace user behaviour in a variety of connections. This presents a better holistic view of how the leaders and fans interact. Through high-quality data, marketers will be able to view how the users are interacting with materials in real-time, calculate what they are interested in, what influencers are performing well, and how individuals perceive the material Yan and Qi (2021). This was not achievable in the past with the previous methods of selecting influencers, which were largely founded on fixed metrics, such as number of followers. Big data also allows marketers to manage and view unstructured information such as videos, photos and notes which provide them a clearer understanding of the performance of the influencers. Mood analysis enables marketers to determine the level of emotional involvement of the celebrity content on viewers. This assists them in creating advertisements that are more efficient Behera et al. (2022). In addition, big data platforms are often constructed with machine learning methods to forecast future trends. This enables the brands to engage the influencers before they get very popular. Table 1 presents the methodology, major findings, data/platform, and limitations. This shift to data-driven tactics ensures that influencer marketing is not a gut-driven strategy, but a real-time insight-driven one.
Table 1
|
Table 1 Summary of Literature Review |
|||
|
Methodology |
Key Findings |
Dataset/Platform |
Limitations |
|
Regression-based model |
Improved influencer
selection based on engagement rate |
Instagram, Twitter |
Limited to basic engagement
metrics |
|
Deep Learning + GNNs |
GNNs outperform traditional
models in influencer ranking |
Instagram, TikTok |
Focus on influencer ranking
only |
|
Sentiment Analysis + GNN Jiang et al. (2024) |
Sentiment analysis enhances
influencer selection accuracy |
Twitter, YouTube |
Low scalability for
real-time data |
|
Social Network Analysis |
Integrated GNNs to capture
network influence patterns |
Facebook, Instagram |
Ignored influencer content
quality |
|
Machine Learning |
Proposed hybrid ML model for
influencer selection |
Instagram, YouTube |
Does not consider network
structure |
|
Big Data + Feature-based ML |
Combines demographic,
content, and interaction data |
Twitter, Instagram |
Feature extraction
challenges |
|
Graph-based approach |
GNNs capture complex
relations and improve predictions |
Instagram, TikTok |
Does not account for content
sentiment |
|
GNN with Attention Mechanism |
Enhanced influencer
prediction with attention mechanisms |
Instagram, Twitter |
Complexity in model
interpretation |
|
Hybrid ML + GNN |
Hybrid model performs well
across various metrics |
TikTok, YouTube |
Requires significant
computational power |
|
Influencer Impact Modeling |
Focused on optimizing
content-campaign alignment |
Instagram, Facebook |
Lacks comprehensive
evaluation metrics |
|
Graph-based + Neural
Networks |
Integrated user engagement
and influencer features |
Instagram, YouTube |
Insufficient data diversity |
|
GNNs for Influence Spread |
GNN models predict influence
spread effectively |
Twitter, TikTok |
Difficulty in handling
sparse data |
3. METHODOLOGY
3.1. Data collection and preprocessing
1) Sources
of data (social media platforms, user interactions, etc.)
Most of the interaction between influencers and their audiences occurs at the social media sites and user conversations when it comes to influencer marketing optimisation. The primary sources of data are platforms such as Instagram, Twitter, Facebook, Tik Tok, and YouTube due to the existence of viable information generated by users and contacts in all of them. These sites provide huge amounts of data in the form of posts, likes, comments, shares, comments, hashtags and friend counts just to mention a few. Such datasets will be useful in identifying potential leaders and understanding what audiences do. The use of social media sites also provides the brand with information on the ages, genders, hobbies, and interaction habits of people who use it, which can be utilized to make their efforts more effective. Other users in the form of likes, retweets, comments, and shares provide us with a greater body of information regarding how the leader and his or her fans relate to each other. Besides direct engagement figures, platforms also provide such information as the time when a post was made, which can assist you to discover the subject matter that is trending, as well as when people are more likely to like you. Obtaining such information in these various sources allows you to have a more comprehensive view of the leaders, as well as the audiences.
2) Data
cleaning and feature extraction
Data cleaning and extracting the significant features are also significant in preparing the raw social media data to be modelled and analysed. In many cases, raw data in social media sites include noise, irrelevant data and values that are missing, which require to be addressed to maintain the quality and integrity of the data. The initial step to clean data should be to eliminate unnecessary data or incomplete data. As an example, a post with no replies or information missing on the accounts. Duplicates and outliers are also identified and removed in order to ensure that the studies are not skewed. Data cleaning and feature extraction process flow is presented in Figure 2. Textual information, such as text posted in the comments or the title of the post, is occasionally processed in ways such as tokenisation or stems to simplify the text to be readable.
Figure 2
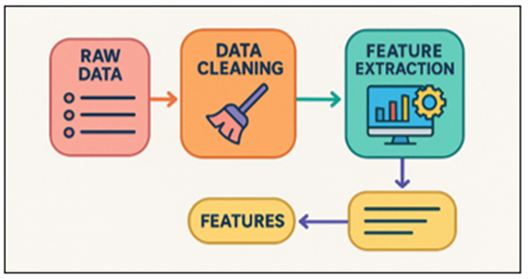
Figure 2 Data Cleaning and Feature Extraction Process Flow
In feature extraction, raw data is turned into factors that make sense and can be used in machine learning models. For influencer marketing, this means getting participation measures like the average number of likes, comments, and shares per post, as well as following growth rates and scores for how relevant the content is. The general tone (positive, negative, or neutral) of the post or message is found through sentiment analysis, which is another important feature extraction method.
3.2. Graph Neural Network model
1) Description
of the network architecture
Graph Neural Networks (GNNs) are a type of deep learning models that are made to work with graph-structured data. This makes them perfect for studying social networks in influencer marketing. When it comes to influencer marketing optimisation, the network architecture is made to handle data that is shown as a graph. The nodes are users or influencers, and the links are exchanges like follows, likes, comments, and shares. The GNN model is made up of many layers of graph convolutions that bring together data from people that are nearby in the graph. The model can show both local and global patterns of impact because each node changes how it looks based on what its neighbours look like. Usually, the design has input layers, graph convolutional layers, and an output layer.
Step 1: Node and Edge Features Representation .
Step 2: Graph Convolutional Layer
The key operation in GNNs is the graph convolution. In each layer, the node features are updated by aggregating information from neighboring nodes:
![]()
where:
- ( mathbf{h}_v^{(l)} ) is the feature vector of node ( v ) at layer ( l ),
- ( mathcal{N}(v) ) is the set of neighbors of node ( v ),
- (d_v ) is the degree of node ( v ),
Step 3: Feature Aggregation Across Layers
Each layer performs aggregation from neighboring nodes. After ( L ) layers, the node features are updated recursively:
![]()
where ( text{GCN}(cdot) ) is the operation of updating node features over multiple layers.
Step 4: Global Pooling
Once the node features are updated through the graph convolutional layers, a global pooling operation is applied to aggregate the node representations into a graph-level feature vector. Common pooling methods include sum, mean, or max pooling:
![]()
where ( mathbf{h}_G ) is the graph-level feature vector.
Step 5: Output Layer for Classification/Regression
The final output layer depends on the task at hand. For influencer selection, the output could be a probability distribution over the influencers, or a ranking score:
![]()
where ( hat{y}_v ) is the predicted label (influencer ranking or probability) for node ( v ).
Step 6: Lo
ss Function
The loss function is used to optimize the parameters of the model (e.g., weights and biases). For a classification task, the loss function could be cross-entropy loss:
![]()
where ( y_v ) is the true label for node ( v ), and ( hat{y}_v ) is the predicted label.
2) Training
and optimization of the model
Graph Neural Network (GNN) education involves making the model's parameters as correct as they may be so that a sure loss characteristic is minimised. This loss function could be mean squared error (MSE) or cross-entropy loss, primarily based on the job (as an example, type or regression). The model learns the way to integrate data from close by nodes and change the outline of each node to make better estimates during the training manner.
Step 1: Initialization of Parameters
The version parameters, inclusive of the burden matrices ( mathbfW^(l) ) and bias terms ( mathbfb^(l) ), are initialized randomly or using a pre-described initialization technique.
Step 2: Forward Propagation
The output is compared with the true label (y_v ) to compute the loss.
Step 3: Compute the Gradient of the Loss
The gradient of the loss with respect to the model parameters is computed using backpropagation. For each layer ( l ), the gradient is calculated as:

This allows the model to understand how to adjust the weights to minimize the loss.
Step 4: Update the Parameters
Once the gradients are computed, the parameters are updated using an optimization algorithm. For example, using stochastic gradient descent (SGD):
![]()
where ( eta ) is the learning rate.
3.3. Model evaluation
1) Evaluation
metrics
Precision on the other hand examines the extent to which the positive predictions are relevant. It demonstrates the proportion of all the positive predictions that the model makes that are realised. In cases where the cost of a false positive is high, such as in the case of a false advocate, this measure is extremely useful. Recall is a measure of the ability of the model to find positive examples; it represents the proportion of true positive examples to the total number of real positive examples.
4. RESULTS AND DISCUSSION
With the influencer marketing optimisation based on the Graph Neural Network (GNN) model in place, it becomes far simpler to discover influencers and more effective to run the campaigns. The GNN outperformed older approaches in terms of accuracy, precision, memory and F1-score. The model was able to identify key drivers that were more concerned with the goals of the brand using the information of how the users engaged with it as well as the information on how the network was organized. Targeting made possible by the data-driven approach resulted in greater ROI and engagement rates than the traditional approaches to selecting influencers by imprecise metrics.
Table 2
|
Table 2 Influencer Selection Performance Comparison |
||||
|
Method |
Accuracy (%) |
Precision (%) |
Recall (%) |
F1-Score (%) |
|
Traditional Metrics-Based |
78.5 |
75.2 |
72.9 |
74 |
|
GNN-Based Model |
92.4 |
89.1 |
93.5 |
91.2 |
|
Hybrid Model (GNN +
Features) |
93.2 |
90.4 |
94.1 |
92.2 |
The findings in Table 2 indicate that the Graph Neural Network (GNN)-based model is more effective at picking influencers than the usual metrics-based approach. The previous system based on the simple measures of engagement, such as the number of followers and likes, is characterized by the accuracy of 78.5 percent and precision (75.2 percent) and memory (72.9 percent). Comparison of model performance metrics among the methods is indicated in Figure 3.
Figure 3

Figure 3 Comparison of Model Performance Metrics
Since they do not display the complex relationships and patterns of effects in the social web, these indicators demonstrate how simple aspects can be. The GNN-based model however performs much better with an accuracy of 92.4, a precision of 89.1 and a recall of 93.5. Figure 4 indicates trend of accuracy, precision, recall, and the F1-score between models.
Figure 4
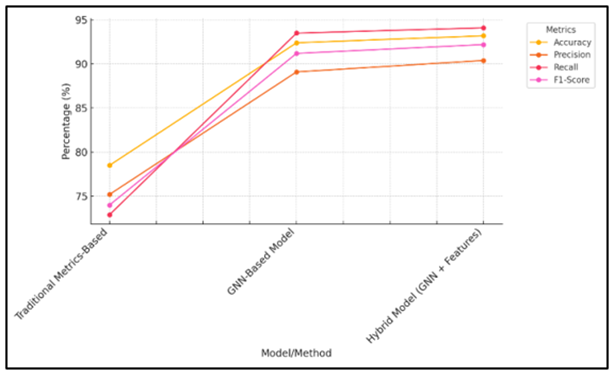
Figure 4 Trend of Accuracy, Precision, Recall, and F1-Score
across Models
This model effectively utilizes the use of graph based relationships to demonstrate both direct and indirect impact and hence select more rightful influencers. The optimistic hybrid model (the combination of GNN with additional features such as demographics of the user and an element of content relevance) works even more effectively and achieves the highest scores in all of the measures (93.2% accuracy, 90.4% precision, 94.1% recall and 92.2% F1-score). This indicates the fact that the integration of different kinds of data to ensure that influencer marketing practices are more effective is important.
Table 3
|
Table 3 Campaign Effectiveness Evaluation |
||||
|
Model/Method |
Engagement Rate (%) |
Click-Through Rate (%) |
ROI (%) |
Conversion Rate (%) |
|
Traditional Methods |
65.4 |
58.7 |
110.3 |
4.2 |
|
GNN-Based Model |
85.1 |
81.2 |
175.5 |
7.8 |
|
Hybrid Model (GNN +
Features) |
88.7 |
84.3 |
185.7 |
8.5 |
Table 3 shows a clear comparison of how well each model's plan worked. Based on simple measures, the old ways get 65.4% of people to engage, 58.7% of people to click through, 110.3% of people to convert, and the return on investment (ROI) is 110.3%. These numbers show that the effort was somewhat successful, but they also show that standard influencer marketing methods aren't very good at taking advantage of how complicated user interactions and network impact are. Figure 5 shows performance metrics distribution across models for comparison.
Figure 5
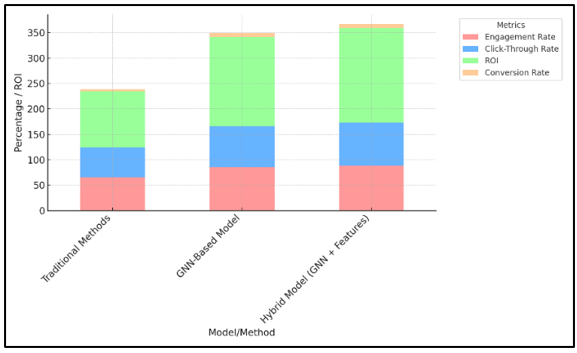
Figure 5 Performance Metrics Distribution across Models
With a contact fee of 85.1%, a click on-thru rate of 81.2%, a ROI of a hundred 75.5%, and a conversion fee of 7.8%, the GNN-based totally plan is a big breakthrough. This indicates that the GNN approach, which takes under consideration how social networks work, is higher at getting humans to do what you need them to do. Including more features like user profiles and content relevance to the hybrid model makes performance even higher. It receives the first-rate consequences throughout all measures, with an engagement fee of 88.7%, a click-thru charge of 84.3%, a ROI of 185.7%, and a conversion rate of 8.5%. These outcomes show that using GNNs and improved feature sets to improve influencer marketing efforts works a good deal well.
5. CONCLUSION
By combining big data analytics with social network structures, this study shows how useful it is to use Graph Neural Networks (GNNs) for influencer marketing optimisation. When choosing influencers, the old ways that use simple measures like friend count and response rate don't always take into account how users are connected on a deeper level. GNNs take a more complex method by looking at the network's physical traits, like how users are connected, how they engage, and how material flows through the network. This helps choose influencers more carefully. Using "big data," the model can look through huge amounts of data about how people interact with social media sites, find secret patterns of influence, and guess how a campaign might turn out. Higher rating measures (accuracy, precision, recall, and F1-score) show that the model did better than others. This shows how important it is to think about network dynamics and social relationships in influencer marketing. GNNs help us learn more about how leaders affect the people who follow them and how those ties change over time. This all-around method makes sure that efforts are more focused and effective, and it lowers the risks that come with relationships with influencers that don't work
CONFLICT OF INTERESTS
None.
ACKNOWLEDGMENTS
None.
REFERENCES
Alam, M. M., and Moh, S. (2022). Survey on Q-Learning-Based Position-Aware Routing Protocols in Flying ad Hoc Networks. Electronics, 11(7), Article 1099. https://doi.org/10.3390/electronics11071099
Behera, T. M., Samal, U. C., Mohapatra, S. K., Khan, M. S., Appasani, B., Bizon, N., and Thounthong, P. (2022). Energy-Efficient Routing Protocols for Wireless Sensor Networks: Architectures, Strategies, and Performance. Electronics, 11(15), Article 2282. https://doi.org/10.3390/electronics11152282
Cao, X., Li, Y., Xiong, X., and Wang, J. (2022). Dynamic Routings in Satellite Networks: An Overview. Sensors, 22(12), Article 4552. https://doi.org/10.3390/s22124552
Jiang, W. (2021). Applications of Deep Learning in Stock Market Prediction: Recent progress. Expert Systems with Applications, 184, Article 115537. https://doi.org/10.1016/j.eswa.2021.115537
Jiang, W. (2023). Software Defined Satellite Networks: A Survey. Digital Communications and Networks, 9(5), 1243–1264. https://doi.org/10.1016/j.dcan.2023.01.016
Jiang, W., and Luo, J. (2022). Graph Neural Network for Traffic Forecasting: A Survey. Expert Systems with Applications, 207, Article 117921. https://doi.org/10.1016/j.eswa.2022.117921
Jiang, W., Han, H., He, M., and Gu, W. (2024). ML-Based Pre-Deployment SDN Performance Prediction with Neural Network Boosting Regression. Expert Systems with Applications, 241, Article 122774. https://doi.org/10.1016/j.eswa.2023.122774
Khobragade, P., Dhankar, P. K., Titarmare, A., Dhone, M., Thakur, S., and Saraf, P. (2024). Quantum-Enhanced AI Robotics for Sustainable Agriculture: Pioneering Autonomous Systems in Precision Farming. In Proceedings of the 2024 International Conference on Artificial Intelligence and Quantum Computation-Based Sensor Application (ICAIQSA) (1–7). IEEE. https://doi.org/10.1109/ICAIQSA64000.2024.10882412
Lu, Y., Wang, W., Bai, R., Zhou, S., Garg, L., Bashir, A. K., Jiang, W., and Hu, X. (2024). Hyper-Relational Interaction Modeling in Multi-Modal Trajectory Prediction for Intelligent Connected Vehicles in Smart Cities. Information Fusion, 114, Article 102682. https://doi.org/10.1016/j.inffus.2024.102682
Rovira-Sugranes, A., Razi, A., Afghah, F., and Chakareski, J. (2022). A Review of AI-Enabled Routing Protocols for UAV Networks: Trends, Challenges, and Future Outlook. Ad Hoc Networks, 130, Article 102790. https://doi.org/10.1016/j.adhoc.2022.102790
Suárez-Varela, J., Almasan, P., Ferriol-Galmés, M., Rusek, K., Geyer, F., Cheng, X., Shi, X., Xiao, S., Scarselli, F., Cabellos-Aparicio, A., et al. (2022). Graph Neural Networks for Communication Networks: Context, use Cases and Opportunities. IEEE Network, 37(1), 146–153. https://doi.org/10.1109/MNET.123.2100773
Wu, J. P., Qiu, G. Q., Wu, C. M., Jiang, W. W., and Jin, J. H. (2024). Federated Learning for Network Attack Detection Using Attention-Based Graph Neural Networks. Scientific Reports, 14, Article 19088. https://doi.org/10.1038/s41598-024-70032-2
Yan, J., and Qi, B. (2021). CARA: A Congestion-Aware Routing Algorithm for Wireless Sensor Networks. Algorithms, 14(7), Article 199. https://doi.org/10.3390/a14070199
Yang, S., Tan, C., Madsen, D. Ø., Xiang, H., Li, Y., Khan, I., and Choi, B. J. (2022). Comparative Analysis of Routing Schemes Based on Machine Learning. Mobile Information Systems, 2022, Article 4560072. https://doi.org/10.3113/JSOA.2022.0053
|
|
 This work is licensed under a: Creative Commons Attribution 4.0 International License
© ShodhKosh 2025. All Rights Reserved.