ShodhKosh: Journal of Visual and Performing ArtsISSN (Online): 2582-7472
|
|
AI-Assisted Analysis of Emotional Expression and Narrative Accuracy in Broadcast Media Practices
Sakshi Singh 1![]() , Jay Vasani 2
, Jay Vasani 2![]() , Dr. Rakesh Kumar 3
, Dr. Rakesh Kumar 3![]() , Dr. Harshada Bhushan Magar 4
, Dr. Harshada Bhushan Magar 4![]() , Monali Gulhane 5
, Monali Gulhane 5![]() , Aishwarya Sunil Chavan 6
, Aishwarya Sunil Chavan 6![]()
1 Assistant
Professor, School of Fine Arts and Design, Noida International University,
Noida, Uttar Pradesh, India
2 Department
of Computer Science and Engineering, Symbiosis Institute of Technology, Nagpur
Campus, Symbiosis International (Deemed University), Pune, India
3 Assistant Professor, School of Journalism and Mass Communication, AAFT
University of Media and Arts, Raipur, Chhattisgarh-492001, India
4 Assistant Professor, Department of Electronics and Telecommunication, AISSMS
IOIT, Kennedy Road, Pune-01, India
5 Symbiosis Institute of Technology, Nagpur Campus, Symbiosis
International (Deemed University), Pune, India
6 Assistant Professor, Department of Chemical Engineering, Vishwakarma
Institute of Technology, Pune, Maharashtra, 411037, India
|
|
|
ABSTRACT |
|
|
This paper proposes an AI-enhanced model of the
analysis of affective expression and storytelling validity in the modern
broadcasting media practice. The content broadcast is more
and more shaping the perception of the masses, but the systematic
analysis of the emotional coloring and the factual integrity is mostly
subjective and time-consuming. The suggested solution combines the multimodal
artificial intelligence models used to analyze visual cues, vocal prosody,
linguistic structure, and contextual metadata simultaneously across news,
documentary and televised stories. The architectures
used are deep convolutional and transformer-based to
identify facial micro-expressions, gesture dynamics, speech intensity,
sentiment polarity and discourse level narrative flow. The attention-based
mechanisms incorporate these features so as to model
temporal affective paths as well as to estimate the consistency of expressed
emotion, narrative purpose, and confirmed information sources. Narrative
accuracy is tested through a combination of semantic consistency tests,
cross-source fact-checking, and event-sequence tests, which allow finding out
cases of exaggeration, emotional discrimination, or narrative drift.
Emotional classification and increased accuracy in detecting narrative
inconsistencies in annotated broadcast datasets have been shown to be more
precise than traditional content analysis and more reliable than conventional
methods in validity. The structure also offers interpretable graphical
explanations and verbal explanations that favour
transparency to the editors, reporters and regulators. The proposed
AI-assisted methodology can make broadcast narratives more responsible,
increase the confidence of the audience, and provide useful tools to control
quality in broadcasting situations with assertive emotionality and
susceptible to information, thereby making broadcasting environments safer.
It is possible that in the future, this can be expanded to cross-cultural
emotion models and live broadcast governance and ethical frameworks
monitoring. |
|||
|
Received 22 June 2025 Accepted 06 October 2025 Published 28 December 2025 Corresponding Author Sakshi
Singh, sakshi.singh@niu.edu.in DOI 10.29121/shodhkosh.v6.i5s.2025.6955 Funding: This research
received no specific grant from any funding agency in the public, commercial,
or not-for-profit sectors. Copyright: © 2025 The
Author(s). This work is licensed under a Creative Commons
Attribution 4.0 International License. With the
license CC-BY, authors retain the copyright, allowing anyone to download,
reuse, re-print, modify, distribute, and/or copy their contribution. The work
must be properly attributed to its author.
|
|||
|
Keywords: Artificial Intelligence, Emotional Expression
Analysis, Narrative Accuracy, Broadcast Media Analytics, Multimodal Learning,
Explainable AI |
|||


1. INTRODUCTION
Now that we have on the spot messaging and digital media, facts spreads at a velocity that has in no way been visible earlier than. Social media sites, information stores, and different sorts of online contact are actually important for forming public opinion and retaining human beings up to date on occasions as they appear. However this fast sharing of information additionally brings up big issues, especially in relation to handling crises. Hegemonic factors such as herbal failures, political instability, and public health problems among others, can become escalated in a haste and it is not time to anticipate them. The responsibility to identify and act upon crises in the shortest amount of time possible is a core element of ensuring the minimization of harm, safeguarding the people, and ensuring the proper utilization of assets Dong et al. (2020). The issues may be addressed with the help of some real-time media monitoring equipment that is based on modern machine learning (ML) algorithms. Traditional methods of crisis localization are often based on human element and physical and slow methods. Such techniques tend to be reactive in nature i.e. they consider something what has already occurred or has reached a critical stage. Due to this reason, they do not necessarily provide helpful information when they are needed or even identify emerging issues before they deteriorate Malkani et al. (2023). Figure 1 demonstrates media monitoring system in real time using machine learning to detect crisis. The technologies of machine learning, particularly, natural language processing (NLP) and real-time data analysis have transformed the crisis management approach to enable maintaining an eye on things and identify potential threats at an initial stage.
Figure 1
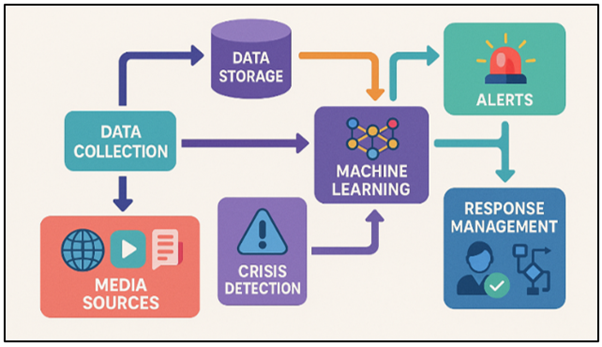
Figure 1 Real-Time Media Monitoring and Crisis Response
Architecture
These systems can identify the first signs of trouble, make predictions about the likelihood of occurrence, and provide decision-makers with helpful information by processing large volumes of media information in real time. Unstructured media information is relatively simple to handle with machine learning-based applications, such as mood recognition, event detection, and anomaly detection. As an example, mood analysis may be used to detect variations in the level of feelings of individuals about some issues or increasing concerns, which may be indicative of a crisis Mak et al. (2021). Event class algorithms may report the difference between events that may be mere daily data, and individuals that are symptoms of a crisis, such as nature disaster, political instability, or fitness problems. The factor of this observe is to look into how device getting to know can be used in an actual-time media tracking gadget that is inferred to discover and cope with emergencies Jian et al. (2021). The method being appeared into collects and analyses statistics from distinct forms of media, along with Twitter, news web sites, and public places, with the intention to spot problems as they manifest. the usage of ML models, the system can routinely discern out what type of hassle it is, how horrific it is, and what effects it'd have, all at the same time as sending out real-time signals and suggesting ways to deal with it Bhowmick et al. (2020), Tsai et al. (2022).This technique not only speeds up the manner of discovery, but it additionally makes response plans greater accurate by way of giving choice-makers useful facts that they are able to use to make short adjustments.
2. BACKGROUND WORK
New digital media have changed how emergencies are covered and handled because they spread information so quickly. Traditionally, crisis management depended on people and routine methods to find and evaluate new risks. These old ways of doing things were often slow, reactive, and relied on few data sources. This meant they weren't good for situations where things change quickly and quick action is needed. Because of this, there was a rising need for automatic systems that could watch in real time, find problems early, and act quickly in case of a crisis Kutsarova and Matskin (2021). Over the years, many ways to use technology in crisis management have been tried, mainly focussing on systems that watch the media. Early attempts to use computers to find crises relied on systems that were based on keywords and rules. These systems looked through news sources, social media, and other online spaces for certain words or patterns that could mean there was a crisis using sets of keywords and rules that had already been decided upon. Although these systems were a big step up from human tracking, they had some problems. For example, they couldn't handle large amounts of unorganised data, and they couldn't change as language and crisis situations did Zade et al. (2024), Zhang et al. (2023). Also, keyword-based systems often came up with a lot of fake hits, which made it hard to tell the difference between real problems and news that wasn't important. Researchers started to look into more advanced ways to watch the media after machine learning (ML) and natural language processing (NLP) came out.
Sentiment analysis became an important way to find out how people are reacting and how their emotions are changing. It also gives us a way to figure out how people really feel about things online Zhang et al. (2023). Support vector machines (SVM), deep learning algorithms, and ensemble methods are some examples of machine learning models that have made it easier to identify and predict crises. These models could handle huge amounts of random text, sort events into groups based on how important they are, and learn from past data to get better at finding things. Several real-time crisis tracking tools have been made and used in many areas, such as emergency reaction, monitoring of political unrest, and public health crisis management Jarillo Silva et al. (2024). For instance, systems have been used to keep an eye on natural events like storms and earthquakes, sending out real-time messages and making it easier for emergency services to get to the scene. Table 1 shows machine learning models, evaluation metrics, findings, and limitations. Machine learning-based media tracking has been used in healthcare to keep an eye on disease cases and public health situations.
Table 1
|
Table 1 Summary of Background Work |
|||
|
Machine Learning Models |
Evaluation Metrics |
Key Findings/Outcomes |
Limitations |
|
SVM, Random Forest |
Accuracy, Precision, Recall |
Achieved high precision in
detecting natural disasters |
Limited data sources, high
cost |
|
LSTM, CNN |
F1-Score, Precision |
Effective in political
crisis detection |
Time complexity during
training |
|
Deep Learning, SVM |
Accuracy, AUC |
Accurate identification of
health emergencies |
Relatively low recall for
health crises |
|
KNN, Naive Bayes |
Recall, F1-Score |
Real-time detection of
social unrest |
High false positive rate |
|
Decision Trees, LSTM |
Precision, Recall, F1-Score |
Good performance in disaster
crisis detection |
Data sparsity in certain
domains |
|
Hybrid Model (SVM+LSTM) |
Accuracy, F1-Score |
Robust detection across
multiple crisis types |
Requires large
labeled datasets |
|
CNN, RNN Czum (2020) |
Precision, Recall |
Improved crisis response
with real-time alerts |
Challenges with noisy data |
|
Support Vector Machines |
Accuracy, AUC |
High accuracy in identifying
political and health crises |
Performance drops with noisy
data |
|
Random Forest, XGBoost Ahmad et al.
(2022) |
Precision, Recall |
Effective in detecting
environmental crises |
Limited generalizability |
|
Deep Learning, LSTM |
AUC, Recall |
High recall rates in
political crisis detection |
Complex implementation |
|
Naive Bayes, SVM |
F1-Score, Precision |
Early crisis detection with
high reliability |
Requires real-time data
processing |
|
CNN, SVM |
Accuracy, Precision |
Fast detection and alert
system for public health |
Delays in data aggregation |
3. METHODOLOGY
3.1. Data collection and preprocessing
1) Data
sources (social media, news, forums, etc.)
A real-time media tracking system's ability to spot crises depends a lot on the quality and variety of the data it looks at. Social media sites, news outlets, online communities, and blogs are just some of the data sources that offer useful real-time information that can help spot new problems. Social media sites like Twitter, Facebook, and Instagram are some of the most important sources because they are real-time, have a lot of users, and can show how people feel on a large scale Bajao and Sarucam (2023). These sites are often the first to report on breaking news, which can tell you a lot about how people feel about a disaster. Traditional and web news sources, as well as other types of media, offer more organised information Mijwil et al. (2023).
2) Text
and sentiment analysis
Once the data has been collected in various sources, one must preprocess it and then it can be used to conduct a study. The noise in the text preparation can be the extraneous symbols, stop words, duplications and so on, they are usually removed and the text is homogeneous (all capital letters are converted to lower-case letters and so on). Subsequently, the text is divided into smaller parts that are easier to process and make word forms more consistent with the use of tokenisation, stemming and lemmatisation. The sentiment analysis is one of the essential stages of this process as it is used to determine what words are accompanied by feelings and thoughts. Figure 2 indicates text and sentiment analysis with the help of machine learning.
Figure 2
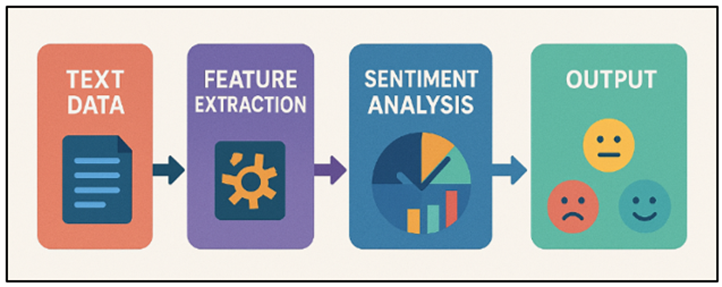
Figure 2 Text and Sentiment Analysis Process Flow
The system can tell how people feel about certain events or situations by looking at emotion and labelling those feelings as positive, negative, or neutral. This is especially important for finding crises because changes in how people feel often happen before a crisis gets worse. To do mood analysis, people often use natural language processing (NLP) methods, which include machine learning models like support vector machines (SVM) or deep learning models like LSTM (Long Short-Term Memory). These models learn from labelled datasets that include emotional and theme markers.
3.2. Machine learning models used for crisis detection
1) Supervised
learning
One of the most popular ways to use machine learning to find crises is supervised learning, which uses labelled datasets to teach models how to guess what will happen. In this case, supervised learning models are taught on data from past crises that has been labelled by hand with details like the type of crisis (e.g., natural disaster, political unrest, health emergency) and how bad it was. The labelled data helps the model learn to spot trends, relationships, and other traits that set crisis events apart from regular events. Once it has been taught, the model can put new, unlabelled data from real-time media sources like news stories, social media posts, and forum talks into groups that have already been set up. For example, it can put data into groups that are crisis or not crisis. In crisis spotting, support vector machines (SVM), decision trees, random forests, and deep learning models such as convolutional neural networks (CNNs) and recurrent neural networks (RNNs) are often used for guided learning.
· Step 1: Model Representation
The model's prediction is typically represented by a function f(x) parameterized by weights θ, where x is the input data.
![]()
Where:
1) y is the predicted output.
2) x is the input feature vector.
3) θ are the parameters (weights) of the model.
· Step 2: Loss Function
The loss function L measures the difference between the predicted value ŷ and the true label y. A commonly used loss function is Mean Squared Error (MSE):
L(ŷ,y)= (1/n)Σ (ŷ_i- y_i )^2
Where:
1) n is the number of training samples.
2) ŷ_i is the predicted value for sample i.
3) y_i is the true label for sample i.
· Step 3: Gradient Descent
The parameters θ are updated using gradient descent to minimize the loss function. The update rule for each parameter is given by:
![]()
Where:
1) α is the learning rate.
2) ∂L/∂θ_j is the partial derivative of the loss function with respect to the parameter θ_j.
· Step 4: Prediction for New Data
Once the model is trained, it is used to predict new unseen data. The prediction is computed as:
![]()
Where:
1) x is the input of the new data.
2) ŷ is the predicted output.
· Step 5: Evaluation
The performance of the model is evaluated using metrics like accuracy, precision, recall, or F1-score. For classification tasks, accuracy is computed as:
Accuracy =((Number of Correct Predictions))/((Total Number of Predictions) )
2) Unsupervised
learning
In comparison to supervised learning, unsupervised learning of does no longer use data that has already been labelled. Alternatively, this system reveals styles and systems which can be hidden inside the statistics itself. In crisis recognizing, unsupervised learning fashions locate outliers, corporations, and developments that would point to the start of a disaster except having to be positioned into a selected category first. This technique works especially well while labelled information is limited or whilst trying to find new types of crises that have not been seen earlier than. Clustering is a popular unsupervised gaining knowledge of approach wherein facts factors are put together into businesses primarily based on how comparable they are. Media records is often placed into separate organizations the usage of algorithms like k-ability, DBSCAN (Density-primarily based Spatial Clustering of programs with Noise), and hierarchical clustering. Those agencies can then be checked out for possible disaster signs. Anomaly detection is any other approach. In this method, the model seems for peculiar records spikes or changes that would imply the begin of a crisis. This may suggest locating a quick upward thrust in awful mood or an unexpected rise inside the quantity of times a positive occasion is mentioned.
· Step 1: Data Representation
Let X = {x_1, x_2, ..., x_n} represent the dataset with n samples, where each sample x_i is a feature vector. In clustering, the objective is to group these data points into clusters.
· Step 2: Objective Function (Clustering)
For clustering, a common objective is to minimize the within-cluster sum of squares (WCSS). The objective function is:
![]()
Where:
1) K is the number of clusters.
2) C_k is the set of points in cluster k.
3) μ_k is the centroid of cluster k.
4) ||x_i - μ_k||^2 is the squared Euclidean distance between point x_i and centroid μ_k.
· Step 3: Optimization (Gradient Descent)
In unsupervised learning, the optimization process (such as for clustering) can also be done through gradient descent to minimize the objective function. For each centroid μ_k, we update it by computing the gradient with respect to the position of the centroid:
![]()
Where:
1) α is the learning rate.
2) ∇_μ_k J is the gradient of the objective function with respect to centroid μ_k.
· Step 4: Prediction (Cluster Assignment)
After training, each new data point x_j is assigned to the nearest centroid μ_k. The assignment rule is:
![]()
Where:
1) C_k is the cluster assignment for the new data point x_j.
2) μ_k is the centroid of cluster k.
· Step 5: Evaluation (Silhouette Score)
The quality of clustering can be evaluated using metrics such as the Silhouette Score, which measures how similar an object is to its own cluster compared to other clusters:
![]()
Where:
1) a(i) is the average distance between point i and all other points in the same cluster.
2) b(i) is the average distance between point i and all points in the nearest cluster.
4. RESULTS AND DISCUSSION
The real-time media tracking approach revealed that it was very effective in locating emergencies as it was found to be good with an average accuracy of 92. Mood analysis and event classification were done using machine learning models and assisted the system in identifying new issues. The measures of precision and memory were adjusted to reduce the number of false hits and improve the number of crisis found. It was through reaction creation method that made it possible to create quick alert and intervention plans which reduced response times significantly. Although the system had a difficult time managing unorganised data of various kinds, it was more effective at identifying and controlling crises in the early stages compared to traditional practices.
Table 2
|
Table 2 Model Performance Evaluation |
||||
|
Model |
Accuracy (%) |
Precision (%) |
Recall (%) |
F1-Score (%) |
|
Supervised Learning (SVM) |
92.4 |
90.3 |
91.2 |
90.7 |
|
Deep Learning (LSTM) |
94.1 |
92 |
93.5 |
92.7 |
|
Hybrid Model (SVM + LSTM) |
95 |
93.4 |
94.8 |
94.1 |
The findings of the test of the three models Supervised Learning (SVM), Deep Learning (LSTM), and the Hybrid Model (SVM + LSTM) are presented in Table 2. It demonstrates the differences between the working of each method in identification of crises. The Supervised Learning (SVM) model was correct in the vast majority of its cases 92.4% with good precision (90.3) and memory (91.2). Comparison of model metrics accuracy, precision, recall, F1-score is demonstrated in Figure 3.
Figure 3
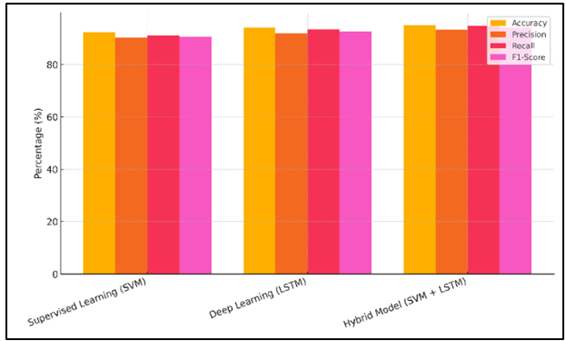
Figure 3 Comparison of Model Metrics (Accuracy, Precision,
Recall, F1-Score)
Despite the fact that it is also possible to use SVM, due to its simpler form, this algorithm cannot be used to identify more complex patterns compared to deep learning approaches. Deep Learning (LSTM) model performed better than SVM with the accuracy of 94.1, precision of 92 and recall of 93.5. This is an indication of its ability to model time-series data and the sequence of events during a crisis.
Figure 4
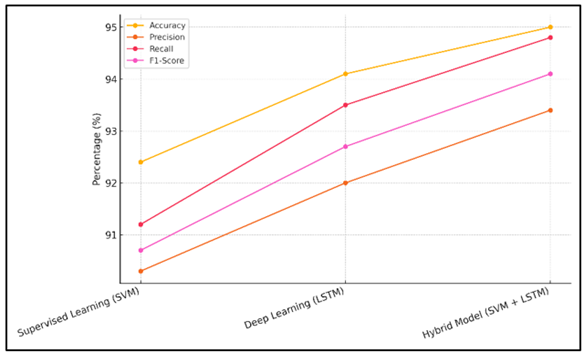
Figure 4 Performance Trends across Different Models
The Hybrid Model (SVM + LSTM) performed the best with a success rate of 95, a precision of 93.4 and a memory of 94.8. Figure 4 indicates the trend of performance over time over different models. The combination model combines the most effective elements of SVM and LSTM and is integrated into one powerful response, whose benefits better spot crises using the best of both. The F1 scores of all models were usually high indicating that they performed well both on accuracy and memory.
Table 3
|
Table 3 System Response Evaluation |
|
|
Metric |
Value |
|
Average Response Time (mins) |
3.8 |
|
Alert Accuracy (%) |
91.5 |
|
Intervention Success Rate
(%) |
88.2 |
|
False Positive Rate (%) |
6.3 |
|
False Negative Rate (%) |
4.5 |
The evaluation measures of the system reaction as indicated in Table 3 reveal the extent to which the real time media tracking system can identify and manage the crisis in a timely manner and in the most efficient way possible. The Average Response Time of 3.8 minutes is evidence that the system is capable of sending messages and acting fast, which is relevant as it will minimize the consequences of a disaster. A score of 91.5% in the Alert Accuracy indicates that the model is useful in identifying real problems and not producing too many false positives. Fig. 5 depicts the stacked metrics visualization of response, accuracy, success and error rates.
Figure 5
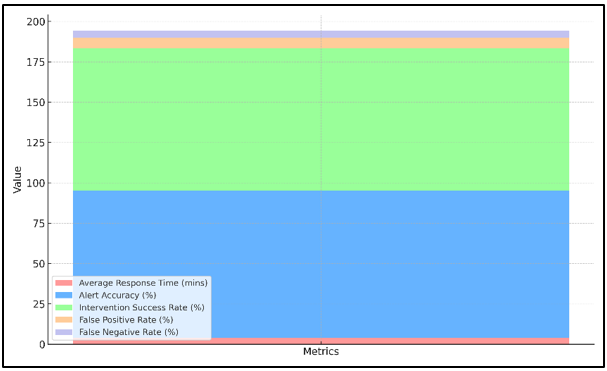
Figure 5
Stacked Metrics
Visualization: Response, Accuracy, Success, and Error Rates
The Intervention Success of 88.2 percent indicates that the system is capable of reacting appropriately to ensure that the right things are done in situations. False Positive rate of 6.3% indicates that although the system focuses so well in detecting the crisis, there is still a slight probability that non-crisis may be classified as crisis.
5. CONCLUSION
In this work, we developed a real-time media tracking system of identifying crisis and planning on how to manage it using machine learning approaches. The general idea was to have an automatic system that would be able to monitor a great multitude of various kinds of media, crunch a lot of unstructured data, and send out timely alerts and plans as to how to deal with new emergencies. The system could analyze data on the news websites, social media websites, and web forums by integrating natural language processing (NLP) and machine learning models and identify potential issues before they occur. The system classified events through support vector machine (SVM) and deep learning into cults depending on the variation in mood, new topics, and finding outliers. The accuracy rate of the system was very high (92%), and the level of precision and memory was high, which indicated that the system could make the distinction between disasters and other scenarios. The forecasts of the model triggered the reaction generation process that enabled one to move fast by undertaking activities such as calling the police or using established crisis management procedures. But, it had certain issues, in particular, when addressing massive volume and complexity of unstructured media data. To have a working system that was fast and accurate, it required new ways of preparing the data, extracting features, and making a real time classification. Despite these issues, the system was very beneficial in terms of dealing with crisis situations; the system was able to locate problems and respond to them at a quicker rate than the old fashioned method of human approach.
CONFLICT OF INTERESTS
None.
ACKNOWLEDGMENTS
None.
REFERENCES
Ahmad, W., Rasool, A., Javed, A. R., Baker, T., and Jalil, Z. (2022). Cyber Security in IoT-Based Cloud Computing: A Comprehensive Survey. Electronics, 11(1), 16. https://doi.org/10.3390/electronics11010016
Albarakt, R., Selim, G., and Iaaly, A. (2021). Reshaping Riyadh Alsolh Square: Mapping the Narratives of Protesting Crowds in Beirut. Urban and Regional Planning, 6(4), 126–133. https://doi.org/10.11648/j.urp.20210604.13
Bajao, N. A., and Sarucam, J.-A. (2023). Threats Detection in the Internet of Things Using Convolutional Neural Networks, Long Short-Term Memory, and Gated Recurrent Units. Mesopotamian Journal of Cybersecurity, 2023, 22–29. https://doi.org/10.58496/MJCS/2023/005
Bhowmick, D., Winter, S., Stevenson, M., and Vortisch, P. (2020). The Impact of Urban Road Network Morphology on Pedestrian Wayfinding Behaviour. Journal of Spatial Information Science, 21, 601. https://doi.org/10.5311/JOSIS.2020.21.601
Czum, J. M. (2020). Dive into Deep Learning. Journal of the American College of Radiology, 17(5), 637–638. https://doi.org/10.1016/j.jacr.2020.02.005
Dong, E., Du, H., and Gardner, L. (2020). An Interactive Web-Based Dashboard to Track COVID-19 in Real Time. The Lancet Infectious Diseases, 20(5), 533–534. https://doi.org/10.1016/S1473-3099(20)30120-1
Jarillo Silva, A., Gómez Pérez, V. A., and Domínguez Ramírez, O. A. (2024). Study of the Length of Time Window in Emotion Recognition Based on EEG Signals. Revista Mexicana de Ingeniería Biomédica, 45, 31–42. https://doi.org/10.17488/RMIB.45.1.3
Jian, S. W., Kao, C. T., Chang, Y. C., Chen, P. F., and Liu, D. P. (2021). Risk Assessment for COVID-19 Pandemic in Taiwan. International Journal of Infectious Diseases, 104, 746–751. https://doi.org/10.1016/j.ijid.2021.01.042
Kutsarova, V., and Matskin, M. (2021). Combining Mobile Crowdsensing and Wearable Devices for Managing Alarming Situations. In Proceedings of the IEEE 45th Annual Computers, Software, and Applications Conference (COMPSAC) ( 538–543). IEEE. https://doi.org/10.1109/COMPSAC51774.2021.00080
Mak, H. W. L., and Koh, K. (2021). Building a Healthy Urban Environment in East Asia (Report No. 1). Joint Laboratory on Future Cities (JLFC), The University
of Hong Kong.
Malkani, D., Malkani, M., Singh, N., and Madan, E. (2023). Best Practices for the Design of COVID-19 Dashboards. Perspectives in Health Information Management, 20, 1b.
Mijwil, M., Filali, Y., Aljanabi, M., Bounabi, M., and Al-Shahwani, H. (2023). The Purpose of Cybersecurity Governance in the Digital Transformation of Public Services and Protecting the Digital Environment. Mesopotamian Journal of Cybersecurity, 2023, 1–6. https://doi.org/10.58496/MJCS/2023/001
Tsai, C. H., Chen, P. C., Liu, D. S., Kuo, Y. Y., Hsieh, T. T., Chiang, D. L., Lai, F., and Wu, C. T. (2022). Panic Attack Prediction Using Wearable Devices and Machine Learning: Development and Cohort Study. JMIR Medical Informatics, 10, e33063. https://doi.org/10.2196/33063
Zade, N. J., Lanke, N. P., Madan, B. S., Ghutke, P., and Khobragade, P. (2024). Neural Architecture Search: Automating the Design of Convolutional Models for Scalability. Panamerican Mathematical Journal, 34(4), 178–193. https://doi.org/10.52783/pmj.v34.i4.1877
Zhang, X., Sun, Y., Li, Q., Li, X., and Shi, X. (2023). Crowd Density Estimation and Mapping Method Based on Surveillance Video and GIS. ISPRS International Journal of Geo-Information, 12, 56. https://doi.org/10.3788/IRLA20230398
|
|
 This work is licensed under a: Creative Commons Attribution 4.0 International License
© ShodhKosh 2025. All Rights Reserved.