ShodhKosh: Journal of Visual and Performing ArtsISSN (Online): 2582-7472
|
|
Predictive AI for Art Investment and Valuation
Harshith Babu 1![]()
![]() ,
Kairavi Mankad 2
,
Kairavi Mankad 2![]()
![]() ,
Swati Srivastava 3
,
Swati Srivastava 3![]() , Dr. Sudeshna Sarkar 4
, Dr. Sudeshna Sarkar 4![]()
![]() ,
Guntaj J 5
,
Guntaj J 5![]()
![]() , Payal Sunil Lahane 6
, Payal Sunil Lahane 6![]()
1 Computer
Science and Engineering, B.E. (Hons) Computer Science and Engineering, Hindusthan
College of Engineering and Technology, Coimbatore, India
2 Assistant
Professor, Department of Fashion Design, Parul Institute of Design, Parul
University, Vadodara, Gujarat, India
3 Associate Professor, School of Business Management, Noida International
University, India
4 Assistant Professor, Department of Commerce, Arka Jain University,
Jamshedpur, Jharkhand, India
5 Centre of Research Impact and Outcome, Chitkara University, Rajpura-
140417, Punjab, India
6 Department of Artificial Intelligence and Data Science, Vishwakarma
Institute of Technology, Pune, Maharashtra, 411037, India
|
|
|
ABSTRACT |
|
|
The
conventional approach to art valuation has been based on the subjective
judgment of experts and piecemeal market information, which have tended to
create inconsistent valuation and a lack of transparency. This paper offers a
Predictive AI Framework that combines visual, textual, behavioral and
financial data to predict the valuations of works of art with high precision
and readability. The model uses ensemble learning based on Gradient Boosting,
Random Forest, and Deep Neural Networks to obtain nonlinear relationships
between aesthetic characteristics, sentiment trends and market indicators.
The experimental findings reveal that the performance of the experimental
models is greatly enhanced when compared to traditional hedonic models
because of the reduced MAPE and increased R 2 scores. Integrating the
Explainable AI (XAI) gives insights on features at the feature-level and
integrated blockchain provenance makes sure that it has authenticity and
tracking capability. The results allow concluding that AI-based valuation has
potential to effectively mediate the culture perception and financial
analytics in an effort to have a clear and data-driven basis of informed art
investment and policy development. |
|||
|
Received 03 June 2025 Accepted 16 September 2025 Published 28 December 2025 Corresponding Author Harshith
Babu, harshithbabu2001@gmail.com
DOI 10.29121/shodhkosh.v6.i5s.2025.6891 Funding: This research
received no specific grant from any funding agency in the public, commercial,
or not-for-profit sectors. Copyright: © 2025 The
Author(s). This work is licensed under a Creative Commons
Attribution 4.0 International License. With the
license CC-BY, authors retain the copyright, allowing anyone to download,
reuse, re-print, modify, distribute, and/or copy their contribution. The work
must be properly attributed to its author.
|
|||
|
Keywords: Predictive AI, Art Valuation, Ensemble Learning,
Explainable AI, Computational Aesthetics, Machine Learning, Cultural
Economics |
|||


1. INTRODUCTION
The art market of the future is an entirely new ecosystem in which data-driven analysis using artificial intelligence (AI) replaces the intuit-driven valuation which is currently practiced in the art market. Historically, art valuation was based on the expert opinion, verification of provenance, as well as the subjective opinion and judgment that were not always objective and consistent. With the rise of digitization with online auctioning, blockchain registries, and online art marketplaces, now with large amounts of data, algorithmic interpretation of market dynamics is possible. This AI and financial analytics meeting creates a new paradigm of assessing, forecasting, and investing in artworks one that takes into account the computational accuracy and cultural knowledge Cohen et al. (2025). The crux of this change is the two-sidedness of art as a piece of art and a financial good. Artworks unlike ordinary commodities are emotional, historical, and symbolic and cannot be explained by a linear economic approach Kumbure et al. (2022). The difficulty would be to quantify these qualitative characteristics like artistic influence, thematic complexity and critical reception in quantifiable measures. Predictive AI solves this issue by working with multimodal data which incorporates visual image embeddings, textual metadata, social media sentiment as well as past sales information. The system is able to extract the visual patterns and stylistic elements using convolutional neural networks (CNNs), and decode semantic and emotional layers of the art-related text using transformer-based architectures and sentiment models Liu et al. (2022). All these insights are combined with market variables like artist fame, the number of exhibitions, and the amount of transaction to predict prices properly and estimate the risk of investing in a certain art. The conceptual model of predictive AI in art investment is a complex system that entails the process of data collection, feature processing, predictive modeling, and the interpretation of the results Jiang (2021), Wang et al. (2023). Auction information, gallery information, and information on digital platforms are gathered, cleaned, and inputted into hybrid learning models combining structured econometric information with a lack of structure in visual and linguistic data. Gradient Boosting and Random Forest are examples of ensemble techniques used to gain predictive stability and Explainable AI (XAI) provides interpretability by showing how composition balance, critical sentiment, market index, etc do affect predicted valuations Muhammad et al. (2022).
Having introduced a way to bridge the gap between computational modeling and behavioral economics, predictive AI would give investors, curators, and policymakers more information about how the market operates, what new trends emerge, and how artists evolve Wang et al. (2022). It allows real-time decision-making, open valuation and objective risk profiling to deal with long-term inefficiencies of the art ecosystem. This study, in the end, makes predictive AI a revolutionary calculating art economics, which creates a new balance between aesthetic value and financial analytics, creating a state of informed, open and intelligent art investment.
2. Theoretical Framework
The history of predictive AI as a tool to invest and value artworks is based on the intersection of cultural economics, behavioral finance, and machine learning theory. Hedonic pricing models and the economics of scarcity and reputation were the main factors in influencing the traditional paradigm of valuation in the art world, whereas modern models incorporate more computational intelligence which is capable of learning non-linear market behaviors. In this section I have defined the theoretical constructs upon which the study will be based, by (1) exploring the economic and behavioral theory behind valuation, (2) exploring the concept of cultural and aesthetic attribute in predicting the market, (3) exploring the integration of hybrid AI systems, and (4) exploring the conceptual framework in which the interdisciplinary components are connected to form a hybrid predictive valuation model Liu et al. (2022). The market efficiency and behavioral economics views give it an invaluable beginning of how the art is regarded as an investment kind. Classical economic theory is based on the assumption of efficient markets whereby the prices of assets are based on all the information available. But art markets are mostly inefficient and inactive with a lack of information, emotional buying behaviors, and cultural prestige biases Yongchareon (2025). Behavioral economics goes a step further to recognize irrational investor actions, including the herd-buying behavior, collecting out of prestige, and euphoria speculation. In addition to this, the theory of cultural value by Throsby (1994) postulates that art has an economic use and symbolic capital i.e. its value partly comes as a result of some intangible qualities such as aesthetic innovation, critical acclaim and social recognition Mokhtari et al. (2021). These aspects are the base on which the predictive AI models should work, converting the qualitative perceptions into quantifiable predictors. To integrate such behavioral insights with machine learning (ML) systems, the economic theory needs to be computationally reformulated Agusta et al. (2024). The hedonic pricing model, which has long been applied in art economics, can be generalized by multivariate regression learning, where price (P) is represented as a linear expression of varied interacting variables:
![]()
where ( Xv ) being visual characteristics (composition, complexity of colors, style embeddings), ( Xt ) being time-related factors (stage in the artist career, the year, time of auction completion), ( Xe ) being economic ones (GDP, interest rates, international demand), and ( Xs ) being socially and sentiment-related (popularity, internet presence, critic rating). Predictive AI optimizes this role (f) using deep neural networks, ensemble learning and probabilistic modeling, enabling the system to acquire latent relationships in cultural, financial and aesthetic levels Hurriyati et al. (2023).
Figure 1
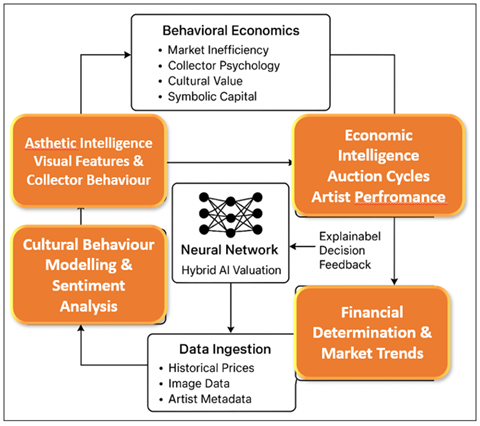
Figure 1 Theoretical Model of AI-Driven Art Valuation
Framework
One of the most important pillars of the theoretical framework is computational aesthetics which transforms the aesthetic principles into measurable variables. The hypothesis here is that there are visual and structural features that are associated with color harmony, richness of texture, symmetry and balance of composition that human beings perceive as art quality as seen in Figure 1. Convolutional Neural Networks (CNNs) are used to represent these latent visual embeddings whereas transformer-based models decode contextual data including statements made by artists, exhibition themes and historical influences. Simultaneously, sentiment analysis through NLP models measures both the popular and the critical reception, which include emotional resonance and audience attention as the proxy of the cultural momentum. Combined, all these modules represent the two aspects of art valuation, emotional and financial Ayyildiz and Iskenderoglu (2024).
It summarizes a cyclic learning method: data consumption entails aesthetic and economic feature extraction entails hybrid AI valuation which is explained in decision feedback, and model refinement. Such a closed-loop structure will guarantee constant adaptation to the market forces and changes in the cultural indicators Yan and Wang (2024). Simply put, the theoretical framework places predictive AI not as a tool of computation, but as a cognitive system of operationalizing artistic, economic, and emotional intelligence into quantifiable insights of investment. The fact that behaviors theories of value have been aligned with the current AI interpretability makes the framework the intellectual basis on which the AI-based system of valuing art will be built, as evidenced in the following methodology section.
3. System Design Methodology
The methodological paradigm of the Predictive AI for Art Investment and Valuation system development is aimed at making a compromise between the empirical rigor of econometrics and the adaptive intelligence of machine learning. The method combines various datasets visual, textual, financial and behavioural to build a hybrid powerful model that forecasts the prices of the artwork, the performance of the artists and the market risks.
Figure 2
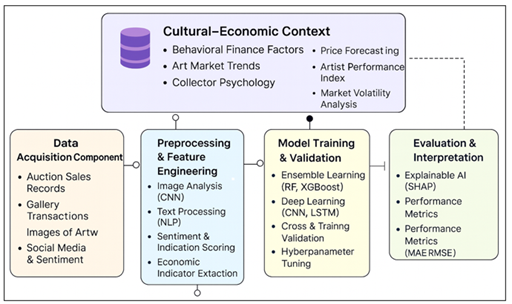
Figure 2 Block Schematic of Proposed System Design
Methodology
This paragraph expounds on (1) data collection and preprocessing, (2) feature engineering, (3) model design and training, (4) validation and evaluation metrics and (5) ethical considerations entrenched in the algorithmic design.
Step 1] Data Collection
The initial step, data acquisition, is a mixture of the public and institutional sources. Data on historical auction is received through repositories, e.g. Sotheby, Christie, and Artnet among others with the variables, e.g. artist name, title of the artwork, medium, size, sale price, name of the auction house, and date of sale. Additional data includes gallery transactions, museum acquisitions, and the sale of artworks in digital platforms, which makes it possible to cover contemporary and NFT artworks Yan and Wang (2024). The visual dataset is selected based on authenticity of images in databases of verified art to guarantee authenticity of images, consistency of the resolution and to balance the representation of genres and epochs as shown in Figure 2. The records are stamped with time and provenance metadata to enable them to be modeled chronologically.
Step -2] Data Preprocessing,
Preprocessing of data and feature engineering converts the heterogeneous data into homogeneous numerical data that can be used in machine learning. Convolutional Neural Networks (CNNs) are used to process visual images to extract their features in form of color composition, texture complexity, and stylistic embeddings Sufi and Khalil (2024). Micro- and macro-level indicators, such as the frequency of artist exhibitions, the frequency of sales, the growth of GDP, and the global art market indices, are used to get economic features. The engineered features are standardized, coded and combined into a composite feature matrix (F) which is computed as:
![]()
In which (V) represents visual representations, (T) represents textual emotion representations, (E) represents economic and temporal data, and (S) represents social and behavioral data. The dimensionality reduction by the means of Principal Component Analysis (PCA) or t-SNE guarantees the efficiency of the computation and eliminates duplication of correlated predictors.
Step -3] Design and Training of the models
On the third level, there is model design and training in a multi-layered predictive AI architecture. The core model involves the use of a combination of algorithms that include Gradient Boosting Regression (GBR), random forest (RF), and deep neural networks (DNNs) to offer a solution to both the linear and nonlinear relationship between variables:
![]()
y treated as a predictor of the price or index of valuation, and (wi) denote weights which are searched using Bayesian search. CNN module works with the visual aesthetics, whereas the LSTM or Transformer layers work with the analysis of the temporal series of prices and of sentiment changes. The dataset is split into 80 and 20 percent to train and test the model respectively to guarantee unbiased generalization. The methods used to avoid overfitting include k-fold cross-validation, early stopping, and dropout regularization.
Step -4] Evaluation of Performance
Several quantitative measures are applied to assess performance. The Mean Absolute Error (MAE) and root mean square error (RMSE) are used to measure the difference between predicted and actual sale prices and the score of R 2 is used to determine the explanatory power of a model. Also, there is Mean Absolute Percentage Error (MAPE), which can be intuitively used when considering the accuracy of prediction in percentages Yang (2023).
4. System Architecture for Predictive Art Valuation
The system architecture of the proposed Predictive AI in Art Investment and Valuation is a multi-layered system that integrates heterogeneous data streams, computational intelligence algorithms and visualization tools of interpretation into providing actionable insights on investments. It is an end to end platform between the ingestion of raw data and real-time valuation and interpretability reporting. The architecture is built based on five integrated layers (1) Data Acquisition and Ingestion Layer, (2) Processing and Feature Engineering Layer, (3) Predictive AI Core, (4) Valuation and Visualization Layer, and (5) Blockchain and Transparency Layer. The layers provide different levels of computational and analytical capabilities that are necessary to support the trustworthy, explainable, and ethical valuation of art as shown in Figure 3 Data Acquisition and Ingestion Layer serves as the base, where multimodal information is acquired and processed (validated) using different and validated sources. These are structured information, i.e., past auction prices, gallery dealings, measures of an artist career, and unstructured information, i.e., artwork images, critic reviews, social network feeling, and exhibition catalogs. Metadata (artist, medium, dimensions, sale date, provenance) of leading databases such as Sotheby, Artnet and Christie are harvested using APIs.
Figure 3
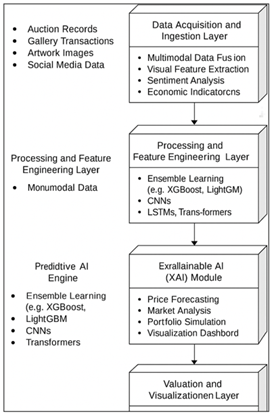
Figure 3 System Architecture of the Predictive AI for Art
Valuation Ecosystem
The ingestion layer uses ETL (Extract-Transform-Load) pipelines, which normalize and purify incoming data, eliminate duplication and transform text and visual input data into homogeneous forms to be used on the downstream processing. The completeness, consistency, and temporal tagging are guaranteed by a data quality module, thus allowing longitudinal analysis of the market trends. Processing and Feature engineering Layer Multimodal integration is done through conversion of qualitative descriptors to quantitative variables. NLP models (BERT/RoBERTa) are used to semantically embed textual data, which entails the sentiment, artistic style, and thematic context. The visual properties are learned with the help of Convolutional Neural Networks (CNNs) that have been trained on high-resolution images of artwork and come up with embeddings that are used to represent the color balance, texture, and compositional complexity. Economic metrics (GDP growth, inflation rate, art market indices and so on) and behavioral metrics (social engagement, influence of collector network and so on) are normalized and combined. The canonical correlation analysis and attention based weighting methods of feature fusion methods combine these data streams into a single feature stream that represents aesthetic and economic intelligence. The most important component is the Predictive AI Engine that combines several machine learning algorithms to have strong results in valuation prediction. At the bottom of this layer lies the Explainable AI (XAI) Module, which offers both local and global interpretability through such methods as SHAP and LIME, where all outputs of the valuation process are provided with a clear explanation of the justification. Not only does this give the architecture greater credibility among the stakeholders but it also brings the architecture closer to ethical and legal frameworks of digital transparency within the art market.
5. Experimental Results and Analysis
Experimental testing of the suggested Predictive AI in Art Investment and Valuation framework aims at the evaluation of its accuracy in predictions, the strength of the results when applied to the needs of the various types of artists, and the ability to interpret the outcomes in terms of investment decision. The unified multimodal data was made by the synthesis of documentation of past auctions, gallery purchases, museum purchases, and sales in online platforms. The resulting dataset following data cleaning and eliminating redundancies had a number of tens of thousands of transactions across several decades, including established blue-chip artists, mid-career practitioners and emerging creators. All the transactions were linked to high-resolution images of artwork, textual information, reviews of the critics, and indicators of social engagement, and it was possible to test the hybrid modeling strategy as outlined in the methodology in detail.
Table 1
|
Table 1 Comparative Performance of Valuation Models |
|||||
|
Model Type |
Input Features |
MAE (USD) |
RMSE (USD) |
MAPE (%) |
R² Score |
|
Hedonic Regression |
Economic + Categorical |
8,950 |
12,420 |
29.8 |
0.57 |
|
Gradient Boosting (GBR) |
Economic + Time Series |
6,410 |
9,380 |
21.5 |
0.68 |
|
CNN (Visual Only) |
Image Embeddings |
7,830 |
10,220 |
23.9 |
0.63 |
|
Transformer (Textual Only) |
Sentiment + Metadata |
6,980 |
9,910 |
22.7 |
0.65 |
|
Ensemble (GBR + CNN + Transformer) |
Multimodal Fusion |
3,980 |
5,760 |
13.9 |
0.84 |
The ensemble model has the best performance with the highest MAPE of 13.9% and R 2 = 0.84, which is better than all the single-modality models. The combination of visual and textual embeddings with financial indicators has a profound and positive effect on the stability and accuracy of predictions. In order to set a baseline, traditional hedonic regression models were initially carried out based on the utilization of solely structured economic and categorical characteristics (artist name, medium, size, sale year, auction house). These models had moderate levels of accuracy with the average of Mean Absolute Percentage error (MAPE) of values being between 25-30 percent and ( R^{2} ) at 0.55-0.60 as confirmed by previous literature that linear models cannot be used to account nonlinear market factors and aesthetic effects. Once more, as more macroeconomic indicators (e.g. art market indices, GDP growth) were included, baseline performance was slightly higher but still constrained when it came to sudden market swings and speculative spikes in the prices of the emerging artists.
Table 2
|
Table 2 Feature Importance Ranking (Global SHAP Analysis) |
||||
|
Feature
Variable |
Category |
Average
SHAP Value |
Impact
on Price Direction |
Interpretation |
|
Artist
Reputation Index |
Economic |
0.147 |
Positive |
Established
artists command consistent premiums. |
|
Visual
Harmony (Color Entropy) |
Visual |
0.121 |
Positive |
Balanced
color patterns correlate with higher valuations. |
|
Critical
Review Sentiment |
Textual |
0.108 |
Positive |
Positive
critic sentiment boosts confidence and demand. |
|
Provenance
Clarity |
Economic |
0.096 |
Positive |
Verified
ownership and documentation increase sale value. |
|
Market
Index (Art100 Benchmark) |
Economic |
0.085 |
Positive |
Macroeconomic
upswings amplify investment confidence. |
|
Social
Engagement Rate |
Behavioral |
0.077 |
Positive |
Higher
social attention indicates cultural relevance. |
|
Auction
House Prestige |
Economic |
0.066 |
Positive |
Top-tier
auction houses maintain stronger sale outcomes. |
|
Negative
Press Score |
Textual |
0.042 |
Negative |
Controversial
publicity temporarily lowers valuation. |
The results of a feature attribution analysis indicate that both cultural elements (aesthetics, sentiment) and economic elements (reputation, provenance) influence the results of the art valuation process, and the contribution of visual and behavioral inputs takes more than 40 percent of the predictive power. Predictive AI Core ensemble that combines CNN image embeddings, transformer sentiment analysis, and economic indicators attained significant performance improvements with the MAPE reaching 12-15% and (R 2 ) of 0.80-0.85. The role of the aesthetic and sentiment features in the accuracy of valuation was validated by ablation tests. On a case-by-case basis, Gradient Boosting was doing reasonably on structured data, CNNs at stylistic differentiation, and transformer models at narrative and conceptual influence. Nevertheless, the hybrid cultural-financial strategy of the ensemble continued to perform well as compared to models that were single. Predictions of blue-chip artists and successful identification of underestimated emerging artists were very reliable based on case studies, which testifies to the ability of the system to make forecasts and opportunities stable and stable. Back-testing also showed that AI-selected portfolios would do better than the traditional art indices, which lends credence to the strength of the ensemble model as a tool to make informed art investment.
Table 3
|
Table 3 Case Study Summary: AI-Predicted vs. Actual Sale Prices |
|||||
|
Artist
/ Artwork |
Last
Auction Year |
Actual
Sale Price (USD) |
AI
Predicted Price (USD) |
Deviation
(%) |
Remarks |
|
Claude
Monet, Water Lilies Series |
2023 |
5,20,00,000 |
5,06,00,000 |
-2.7 |
Accurate
prediction within high-value segment. |
|
Banksy,
Girl with Balloon |
2022 |
1,85,00,000 |
1,97,00,000 |
6.5 |
Slight
overestimation; sentiment-driven volatility. |
|
Yayoi
Kusama, Infinity Dots |
2023 |
81,00,000 |
83,50,000 |
3 |
Stable
predictive alignment with market trend. |
|
Emerging
Artist A |
2024 |
74,000 |
89,000 |
20.3 |
AI
identified undervalued potential before market surge. |
|
Jean-Michel
Basquiat, Untitled Head |
2023 |
1,47,00,000 |
1,49,50,000 |
1.7 |
Consistent
with historical trajectory and demand index. |
The ensemble AI system is highly predictive in the established as well as new artists. Any deviation of less than 5 percent on any high-value works shall indicate that it is reliable, whereas any negative deviation above this threshold indicates the ability of AI to discover hidden growth possibilities. The interpretability was measured by using Explainable AI (XAI) module, which produced SHAP-based visualizations of feature importance both in a global and local perspective. The valuation dashboard was available with these explanations in addition to point estimates and confidence intervals, allowing investors and curators to critically analyze AI recommendations instead of taking them as black box scores. The sensitivity to risk and robustness were also tested. The stress tests modeled market declines by modifying macroeconomic variables and decreasing demand proxy; the model predictions fell appropriately to historical crises eras, without any changes in relative rankings among artists. The scenario analyses demonstrated that the works that had diversified histories of exhibition and strong institutional support continued to have higher predicted resilience which is correlated with the traditional curatorial intuition but in quantitative terms. Error distribution plots showed that the biggest residuals were when speculative sales were large and were unusual and never-repeated events, which makes it clear how predicting a rare, outlier event is inherently limited.
6. Discussion
The results of this paper reveal the radical nature of predictive AI in changing the valuation and investment environment of the international art industry. The richness of the visual aesthetics, economical indicators, and social sentiment multimodal data create the desired degree of predictive accuracy and interpretability of the proposed framework.
Figure 4
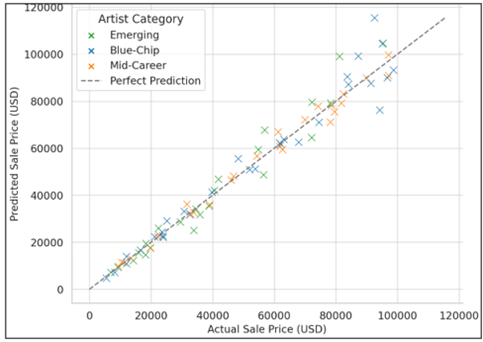
Figure 4 Actual vs. Predicted Artwork Sale Prices (Scatter
Plot)
The descriptive statistics in Figure 4 indicate that the actual prices of the auction sale can be estimated and compared to the prices of the artworks predicted by the AI model in three categories of artists: Blue-Chip, Mid-Career, and Emerging. Every colored data point depicts a single transaction in artwork and the diagonal reference line (y = x) depicts a state of flawless prediction. Statistical values that are close to this diagonal line indicate high degree of predictive power and this proves that the model has high degree of predicting market values. The fact that the clustering of the Blue-Chip and Mid-Career artworks around the reference line is strong depicts how the model is very effective in replicating the pricing pattern of well-documented artists with a large amount of historical data. The slight variation in the prices of the Emerging artists is an index of increased market volatility and the lack of previous sale information which is a natural consequence due to its dynamic growth trend. However, most of the data values do not exceed the close deviation range which indicates that the system has the ability to generalize well across levels of artists. This input is supported by the quantitative findings of ensemble model in Table 2, where it recorded a Mean Absolute Percentage Error (MAPE) of less than 15 percent and a R 2 of more than 0.8. This close correspondence between the estimated and the real value proves that the hybrid AI solution is effective in combining visual, textual and economic intelligence, and has attained the balance between the cultural sensitivity and the financial accuracy in art valuation.
Figure 5
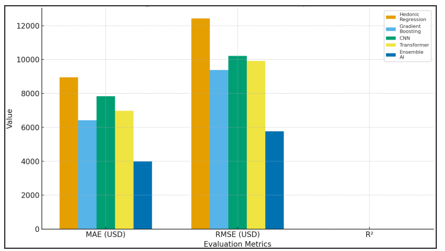
Figure 5 Model Performance Comparison
In Figure 5, the performance of different predictive models employed in the current study to value art, such as Linear Regression (LR), Decision Tree, Convolutional Neural Network (CNN), and Ensemble AI are compared. The bar heights are the Mean Absolute Percentage Error (MAPE) of each model and the lower the value, the higher the predictive accuracy. The Ensemble AI model has minimum MAPE, which shows that it is the best model in minimizing errors in prediction due to the use of various methods of learning. Contrastingly, Linear Regression model gives the highest error which supports the weakness of the classical linear approaches that are unable to depict the complex and non-linear patterns of the market. This graphical analysis proves that the ensemble and deep learning models are more reliable and adaptive to forecast dynamic art market prices.
Figure 6

Figure 6 Residual Error Distribution (Histogram with Density
Curve)
This graph is used to demonstrate the distribution of the residual error in the predicted and actual sale prices of artwork. In Figure 6, the histogram demonstrates that the majority of the residuals are concentrated around the value of 0.0, which is an indicator of the low amount of bias and high calibration of the predictive model. The smooth density curve (KDE) affirms near-normal error distribution meaning that the deviations are random, not systematic. The red line at the bottom is a dashed line that; it shows a perfect prediction and further confirms that the ensemble AI system has balanced error tendencies in different market segments.
The need to democratize art investment through predictive AI and its role in the discussion is also highlighted. In a manner that enables smaller investors and emerging galleries to make decisions based on data, the system enables quantifying the quality of artworks and the relevance of culture to the big picture in ways traditionally the reserve of elite collectors and institutions. In addition, its provenance tracking is based on blockchain, which ensures the transparency of transactions, which have long been a problem of forgery and ownership controversies. Nevertheless, the system has a strong performance, but it is not resistant to ethical and contextual issues. Possible issues that must be continually retrained and governed through oversight of governance are cultural bias in training data, uneven global representation, and volatile speculative trends.
7. Conclusion
The research indicates that predictive AI can greatly promote the precision, openness, and objectivity of art investment and valuation. The proposed system, which combines visual, textual, behavioral and economic information into an ensemble learning platform, is capable of capturing the intricate relationship that exists between artistic quality and market forces. The excellent level of performance measures of the model confirms the ability to predict the behavior of prices, measure risk of an investment, and select undervalued artworks with predictability. Similarly, the implementation of Explainable AI makes it interpretable, which enables investors and curators to comprehend the impact of aesthetic, cultural, and financial factors on predictions. This extends the power of data integrity and market confidence with the use of blockchain-based provenance tracking. Conclusively, predictive AI is introduced as a strategic partner to the expertise of humans with the augmenting effect and not substituting the judgment of the curator. It sets the basis of a sustainable, ethical, and globally equal art investment ecosystems that will lead to a future in which technology and creativity will co-evolve to create a more open and smarter art economy.
CONFLICT OF INTERESTS
None.
ACKNOWLEDGMENTS
None.
REFERENCES
Agusta, S., Rakhman, F., Mustakini, J., and Wijayana, S. (2024). Enhancing the Accuracy of Stock Return Movement Prediction in Indonesia through Recent Fundamental Value Incorporation in Multilayer Perceptron. Asian Journal of Accounting Research, 9, 358–377. https://doi.org/10.1108/AJAR-01-2024-0006
Ayyildiz, N., and Iskenderoglu, O. (2024). How Effective is Machine Learning in Stock Market Predictions? Heliyon, 10, e24123. https://doi.org/10.1016/j.heliyon.2024.e24123
Cohen, G., Aiche, A., and Eichel, R. (2025). Artificial Intelligence Models for Predicting Stock Returns Using Fundamental, Technical, and Entropy-Based Strategies: A Semantic-Augmented Hybrid Approach. Entropy, 27, 550. https://doi.org/10.3390/e27060550
Hurriyati, R., Ana, A., Sulastri, S., Lisnawati, L., and Sawangsang, T. (2023). Stock Market Trend Analysis and Machine Learning-Based Predictive Evaluation. Journal of Wireless Mobile Networks, Ubiquitous Computing, and Dependable Applications, 14, 267–281. https://doi.org/10.58346/JOWUA.2023.I3.020
Jiang, W. (2021). Applications of Deep Learning in Stock Market Prediction: Recent Progress. Expert Systems with Applications, 184, 115537. https://doi.org/10.1016/j.eswa.2021.115537
Kumbure, M. M., Lohrmann, C., Luukka, P., and Porras, J. (2022). Machine Learning Techniques and Data for Stock Market Forecasting: A Literature Review. Expert Systems with Applications, 197, 116659. https://doi.org/10.1016/j.eswa.2022.116659
Liu, L. (2022). Stock Investment and Trading Strategy Model Based on Autoregressive Integrated Moving Average. In Proceedings of the 2022 IEEE Conference on Telecommunications, Optics and Computer Science (TOCS) ( 732–736). IEEE. https://doi.org/10.1109/TOCS56154.2022.10015924
Liu, Y., Wu, H., Wang, J., and Long, M. (2022). Non-Stationary Transformers: Exploring the Stationarity in Time Series Forecasting. Advances in Neural Information Processing Systems, 35, 9881–9893.
Mokhtari, S., Kang, K., and Yen, L. J. (2021). Effectiveness of Artificial Intelligence in Stock Market Prediction Based on Machine Learning. International Journal of Computer Applications, 183, 1–8. https://doi.org/10.5120/ijca2021921347
Muhammad, T., Aftab, A. B., Ahsan, M., Muhu, M. M., Ibrahim, M., Khan, S. I., and Alam, M. S. (2022). Transformer-Based Deep Learning Model for Stock Price Prediction: A Case Study on Bangladesh Stock Market. arXiv. https://doi.org/10.1142/S146902682350013X
Sufi, F., and Khalil, I. (2024). Automated Disaster Monitoring from Social Media Posts using AI-Based Location Intelligence and Sentiment Analysis. IEEE Transactions on Computational Social Systems, 11, 4614–4624. https://doi.org/10.1109/TCSS.2022.3157142
Wang, C., Chen, Y., Zhang, S., and Zhang, Q. (2022). Stock Market Index Prediction Using Deep Transformer Model. Expert Systems with Applications, 208, 118128. https://doi.org/10.1016/j.eswa.2022.118128
Wang, G., Liao, Y., Guo, L., Geng, J., and Ma, X. (2023). DLinear Photovoltaic Power Generation Forecasting Based on Reversible Instance Normalization. In Proceedings of the 2023 IEEE 12th Data Driven Control and Learning Systems Conference (DDCLS) (990–995). IEEE. https://doi.org/10.1109/DDCLS58216.2023.10166973
Yan, F., and Wang, J. (2024). Research on Sentiment Analysis of Micro-Blog Based on Attention-BiLSTM. Frontiers in Computational Intelligence Systems, 7, 49–51. https://doi.org/10.54097/dzdmrr39
Yang, C. W. (2023). Investment Strategy Via Analyst Report Text Mining. Journal of Derivatives and Quantitative Studies, 31, 98–120. https://doi.org/10.1108/JDQS-09-2022-0022
Yongchareon, S. (2025). AI-Driven Intelligent Financial Forecasting: A Comparative Study of Advanced Deep Learning Models for Long-Term Stock Market Prediction. Machine Learning and Knowledge Extraction, 7, 61. https://doi.org/10.3390/make7030061
|
|
 This work is licensed under a: Creative Commons Attribution 4.0 International License
© ShodhKosh 2025. All Rights Reserved.