ShodhKosh: Journal of Visual and Performing ArtsISSN (Online): 2582-7472
|
|
Data Visualization as a Form of Sculptural Art
Manivannan Karunakaran 1![]()
![]() ,
Praney Madan 2
,
Praney Madan 2![]()
![]() ,
Sachin Pratap Singh 3
,
Sachin Pratap Singh 3![]()
![]() ,
Peeyush Kumar Gupta 4
,
Peeyush Kumar Gupta 4![]()
![]() ,
Mohd Faisal 5
,
Mohd Faisal 5![]()
![]() , Fazil Hasan 6
, Fazil Hasan 6![]() , Mahesh Kurulekar 7
, Mahesh Kurulekar 7![]()
1 Professor
and Head, Department of Information Science and Engineering, JAIN (Deemed-to-be
University), Bengaluru, Karnataka, India
2 Centre
of Research Impact and Outcome, Chitkara University, Rajpura- 140417, Punjab,
India
3 Assistant
Professor, Department of Journalism and Mass Communication, Vivekananda
Global University, Jaipur, India
4 Assistant
Professor, ISDI - School of Design and Innovation, ATLAS SkillTech
University, Mumbai, Maharashtra, India
5 Lloyd Law College, Greater Noida, Uttar Pradesh 201306, India
6 Associate
Professor, School of Business Management, Noida international University, India
7 Department
of Civil Engineering Vishwakarma Institute of Technology, Pune, Maharashtra,
411037, India
|
|
|
ABSTRACT |
|
|
Data
visualization, the interconnection of information and sculptural art is a new
paradigm where information moves out of the digital screens and finds space
in the physical world to express itself. This paper examines the conceptual,
aesthetic and technological systems that allow the data to be physically
realized as three dimensional artworks. It investigates how datasets are
transformed algorithmically and modeled computationally into forms that
provoke sensory, emotional and intellectual interaction. The paper
contextualizes the current practices in the context of the historical path of
abstract visualization and data physicalization to
identify the connection of the modern practice with the information design
and artistic tradition. The research methodologically describes the following
processes: the choice of the dataset, semantic-geometric mapping, application
of digital fabrication tools, including 3D printing, CNC, and laser cutting.
Machine learning adds value to the technological ecosystem by supporting
pattern extraction, generative modeling through Grasshopper and Houdini, and
previews of the sculpture in real-time. The aesthetic inquiry is concerned
with the ability of the physicalized information to tell visual tales,
mediate perception, balance between science and creative interpretation. It
is further discussed with regards to issues of material constraints,
sustainability and representation of multidimensional datasets. This study,
finally, makes the data-driven sculpture be both an art and an
epistemological practice, i.e. the way of turning data into an embodied and
spatial conversation of information, materiality and human experience. |
|||
|
Received 18 April 2025 Accepted 24 August 2025 Published 25 December 2025 Corresponding Author Manivannan
Karunakaran, manivannan.k@jainuniversity.ac.in DOI 10.29121/shodhkosh.v6.i4s.2025.6863 Funding: This research
received no specific grant from any funding agency in the public, commercial,
or not-for-profit sectors. Copyright: © 2025 The
Author(s). This work is licensed under a Creative Commons
Attribution 4.0 International License. With the
license CC-BY, authors retain the copyright, allowing anyone to download,
reuse, re-print, modify, distribute, and/or copy their contribution. The work
must be properly attributed to its author.
|
|||
|
Keywords: Data Physicalization, Generative Design, Computational
Sculpture, Aesthetic Information Mapping, Digital Fabrication |
|||


1. INTRODUCTION
Data visualization has taken the form
of the interface between creative expression and analytical thinking in the
changing world of art, design and information science. Visualization has
traditionally been focused on the two-dimensional charts, infographics and
dashboards and helped to make sense of complex data by converting numerical or
categorical data into visual patterns that can be observed. Nevertheless, with
the emergence of new computational technologies, generative modeling,
and the physicalization of data, this area has now
gone beyond the flat screen- it is now physically represented as data physicalization or sculptural visualization. This change
does not just imply a shift in medium but paradigmatic shift in the way in
which data may be perceived, understood and embodied. The process of
transforming abstract data into three-dimensional sculptural constructions
changes the interaction between the object, information, and the viewer,
establishing novel perception, emotion, and interaction possibilities. The
concept of data as matter is consistent with the wider art trends that mislead
the boarders between science and aesthetics Nisiotis et al. (2020). According to the same logic as the traditional sculpture,
where imagination and physicality are transformed into form, the data-driven
sculpture combines algorithmic logic with artistic intent, bringing thoughtless
phenomena into the real world, as the material interactive sculpture. An
example would be the metrics of climate change in the form of undulating
topographies; the feelings of the social media in the form of pulsating organic
forms; and the sound frequencies represented by a complex lattice. These
representations disrupt the traditional definition of art and analytics since
it no longer revolves around accuracy but rather expressive embodiment, the
place where the meaning is created through the combination of information,
design and physical environment Monaco et al. (2022).
Gradually, with the democratization of
computation, as made available through software such as Processing,
Rhino-Grasshopper and TouchDesigner, artists and
designers developed a new mode of engagement through information, as both input
and co-creator in the generative process. This development is a major point of
convergence of art and technology - making datasets sculptural grammars that
can be created, displayed, and touched in the physical world. Regarding the
perception, sculptural data visualization allows the experience of a
multi-sensory perception. Physical forms, unlike the visualizations on the
screen, touch, spatial orientation and emotional resonance are all used Bekele et al. (2018). This was a dimension of touch that helps to create a
deeper sense of connection with the audience and makes the audience curious and
reflective. It makes information interpretation more democratic, as any human
being, not only specialists, is able to explore information physically,
understand patterns and feel the connection. Figure 1 demonstrates
multistage framework on the basis of which data is
converted into expressive visualizations in sculptural form. Additionally,
these physical experiences have the ability to cross over linguistic and
cognitive boundaries so that complex data could speak conceptually using space
and material representation.
Figure 1
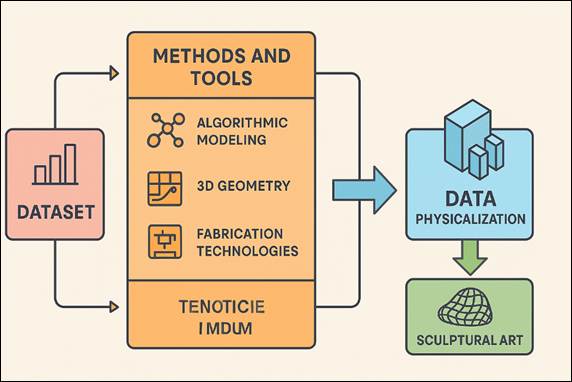
Figure 1 Multistage Framework of Data
Visualization as Sculptural Art
This new form of art provides a merging
of data analytics, machine learning, and generative design that is
technologically exploited. Parametric and algorithmic design tools transform
the patterns found in datasets into morphologies that can be fabricated,
whereas machine learning models reveal the latent patterns found in the
datasets. In terms of digital models, 3D printing, CNC milling and laser
cutting, techniques bring digital models into contact with material reality,
and translation of pixels into physicality, in other words, is smooth Maiwald et al. (2021). Such sculptural works are frequently supplemented with
interactive and kinetic, in which the sculpture is sensitive to real-time data
feeds, and thus represents a story in flux.
2. Theoretical Foundations
2.1. Definitions of data visualization, physicalization, and sculptural interpretation
Data visualization is the art of
interpreting either numerical or categorical data in visual ways that can be
used to identify patterns, generate insights as well as communicate. It is a
cognitive interface between the complexity of information and human perception
in that abstract datasets can be perceived in the form of color,
geometry and space. However, data physicalization
takes this process one step further into the physical world, where data is
instantiated in the form of physical, and often three dimensional, objects Rahaman et al. (2019). These objects may be passive or interactive and the users
are invited to engage with information by touching it, moving it, and
navigating a space. Physicalization makes
visualization physical, so that information which is abstract and intangible is
actualized in three-dimensional sculpture that blends informational logic with
aesthetic purpose Arrighi et al. (2021).
2.2. Historical Evolution from Symbolic Abstraction to Tangible Forms
The evolution of the symbolical
abstraction into the physical data representation is both the indicator of the
technological progress and the alterations of the thought of the art. The
origins of visualization that include the statistical charts developed by
William Playfair in the 18th century may be regarded as the foundation of the
symbolic form of abstraction since both of them attempted to reach the clarity
through the use of geometric simplicity. As the speed of computing increased in
the 20th century, information visualization started to take center
stage in the scientific exploration in the shape of digital graphs, network
maps, and algorithmic renderings that reduced the complexity to abstract visual
syntax Ceccotti (2022). With this also came a new generation of cybernetic and
information aesthetics, including Max Bense and Herbert Franke, which began to
conceptualize in terms of information as an art material, and to emphasize the
aesthetic constituent of information. Experimental intersections were pursued
in the 1960s and 1970s by artists such as Vera Molnar and Frieder Nake and
Edward Ihnatowicz to make geometric compositions and robotic sculptures. These researches marked the transition to the data-driven art
concept to combine the rational programming with the sensory representation Rauschnabel et al. (2022). Later 20th and early 21st centuries gave such
conceptualizations digital construction, and parametric modeling
and made the data physically manifest itself in sculptural forms possible.
2.3. Conceptual Frameworks Linking Aesthetics, Perception, and Information Design
Theoretical models of the relationships
between aesthetics, perception, and information design explain human cognition
in information-processing modes other than the analytical-cognitive one sensory
and emotional cognition. The Gestalt-based perception theory postulates that
people desire to achieve coherence and pattern recognition in visual forms.
When this principle is applied to the data visualization and physicalization, aesthetic harmony, balance, and rhythm
help to understand. Aesthetics, in turn, does not serve as ornamentation but as
an epistemological instrument which contributes to more understanding and
emotional appeal Theodoropoulos and Antoniou
(2022). In information design, aesthetics is the facet between
disclosure and involvement. Perceptual affordances are directed toward
attention and meaning-making by the material, color
and spatial organization. Intentionality Artistic intentionality adds to this
model: visualizations in sculpture goes beyond a description of data to include
interpretive stories that arouse the imagination and thought. Table 1
summarizes related works in terms of the methods, use of data, contribution and
limitation. Fusing semiotics, the study of signs and meaning, with
computational design, such works convey in both quantitative and qualitative
truth, the quantitative truth of information and the qualitative truth of
composition.
Table 1
|
Table 1 Comparative Overview of Related Works in
Data-Driven Sculptural Visualization |
||||
|
Project Title |
Data Type Used |
Technique |
Material or Medium |
Impact |
|
Artistic Data Sculptures for Social Visualization |
Social Media Text Data |
Aggregated Pattern Mapping |
Acrylic Layers |
Enhanced audience empathy via transparency and
layering |
|
Opportunities and Challenges for Data Physicalization |
Multivariate Data |
Data-to-Form Encoding Framework |
Mixed Materials |
Defined taxonomy for physicalization
approaches |
|
Exploring Tangible Data Representations |
Quantitative and Qualitative Data |
Tangible Interaction Models |
3D Printed Objects |
Highlighted tactile engagement benefits |
|
Data by Proxy: Material Traces and Quantified
Reality Lo Turco et
al. (2022) |
Urban Environmental Data |
Trace-Based Physical Mapping |
Metal & Concrete |
Connected environmental sensing with artistic
form |
|
Data Physicalization:
From Visual to Tangible Willkens et al. (2020) |
Scientific Data |
Algorithmic Mapping to Geometry |
PLA / Resin |
Promoted hybrid data interpretation frameworks |
|
Affective Data Sculptures: Emotive Quantification |
Biometric / Emotional Data |
Generative Emotion Mapping |
3D Printed Resin |
Demonstrated emotional connection via physical
data |
|
Critical Info-Aesthetics Pourmoradian et al. (2021) |
Cultural & Textual Data |
Conceptual Visualization |
Paper / Wood |
Encouraged critical interpretation over utility |
|
Tangible Topographies of Data |
Geospatial / Climate Data |
Topographic Height Mapping |
CNC Wood Panels |
Enhanced geographic cognition through tactile
surfaces |
|
Algorithmic Art and Information Aesthetics El-Said and
Aziz (2022) |
Mathematical Structures |
Algorithmic Plotting |
Ink / Plotter |
Inspired digital-to-physical generative art
lineage |
|
Embodied Data Narratives in Installation Art |
Behavioral Data |
Generative Spatial Composition |
Metal Frames + Light |
Fostered immersive environmental storytelling |
3. Data Physicalization and Sculptural Expression
3.1. Principles of transforming datasets into three-dimensional structures
Convergence of data science,
computational geometry and aesthetic design is the key to transformation of
datasets into three dimensional structures. The basic principle is to map the
abstract variables on spatial dimensions whereby the numerical or categorical
data defines the data parameters like the shape, scale, curvature, texture, or
density. That process turns the raw data into an embodied spatial narrative
that allows perceiving patterns in terms of volume and proportion Luther et al. (2023). The overall shapes are not literal copies of information
but beautiful representations which strike a balance between accuracy and
expressionism. Also, the symmetry aspect, rhythm and structural stasis play a
role in the final result, making sure that the sculpture has artistic unity, as
well as, material viability.
3.2. Materiality and Form: Wood, Metal, Acrylic, Digital Fabrication
Materiality is very important in
defining how the data-driven sculptures convey meaning, emotion, and the sense
of touch. The decision of material, whether it is a wood, metal, acrylic or
hybrid composites is not only an aesthetic but a conceptual decision, between
the physical and informational dimension of the piece of art Pisoni et al. (2021).
Wood is cozy, organic, and man-made,
and is typically appropriate in the depiction of ecological or chronological
data. Figure 2 indicates the combination of materiality and form to make
data-driven sculptural objects. Its texture and grain bring in a natural
irregularity to counter anything that is algorithmic and focus on the
discussion between nature and data. Metal, as a material that is rigid and
reflective, is an icon of strength, modernity and permanence. Industrial or
infrastructural data can be represented as stainless steel or aluminum, whereas more complex inscriptions of data can be
made on surfaces, such as anodizing or laser etching. The transparency of
acrylic and other translucent materials is used as a metaphor of clarity, flow
and immateriality, which is best suited to represent light-based or fluid
datasets. These materials are dynamically receptive to lights and cast changing
patterns and shadows, which bring the data experience out into environmental
space.
Figure 2
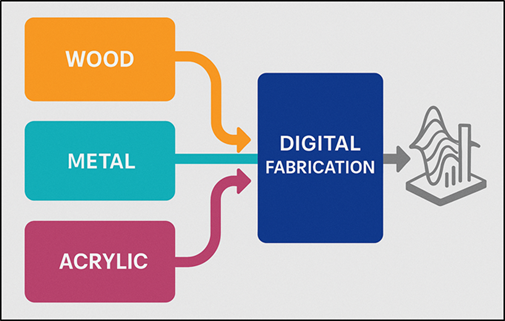
Figure 2 Materiality and Form Integration in Data-Sculptural
Fabrication
3.3. Spatial Composition, Embodiment, and Viewer Interaction
In data-based sculpture, spatial
composition characterizes the positioning and relations of information
concerning physical and perceptual space. In contrast to the conventional
visualization where meaning is limited to a frame or a screen, data sculpture
as a spatial experience is a three-dimensional experience. The composition is a
coordination of scale, direction, rhythm, to define the way the viewer
perceives and manages the form. Designers apply rules of equilibrium,
repetition and contrast to scale data relationships into choreography of
volume- where every curve, gap or density contains a certain pattern of
information. Embodiment introduces an additional performative aspect, which
places the data as well as the viewer into a common space of dialogue. With the
viewer walking about the sculpture, there is a change in perspective as new
correlations and hierarchies become evident and thus observation becomes
interpretation. The interactive technologies like sensors, LEDs, or kinetic
mechanisms are incorporated in some works and react to real-time streams of
data or the nearness of the audience.
4. Methods and Design Process
4.1. Dataset selection and semantic mapping to 3D geometry
The making of data-driven sculptures
starts with the strategic selection of the dataset, thus defining the
conceptual purpose as well as the logic of the structure behind the final form.
The selected data set should be semantically rich - it needs to have a story or
a thematic meaning which qualifies its translation into a physical form. As an
example, the climate records, or population movements or emotional sentiment
data each have visual languages that are distinctly dissimilar when turned into
geometry. One should not reproduce the data word-to-word but rather distill the expressive properties of the data to find the
variables that can be expressed by the means of shape, volume, and material.
After curating and cleaning the data, the next stage is called semantic mapping
and it involves matching data variables with the associated geometric
parameters. Spatial elements like height, curvature or density are associated
with quantitative aspects like frequency, magnitude or correlation. Colors, textures or modular arrangements can be defined by categoricals. Such mapping creates a visual grammar, which
allows data relationships to appear in the three-dimensional structure.
4.2. Algorithmic Modeling and Computational Design Techniques
Data-sculptural design consists of
algorithmic modeling as its creative and technical
backbone, that is, semantic mappings are transformed into actual geometries by
rule-based computation. Algorithms in this stage are generative systems that
perceive the information input to create complex forms that cannot be created
manually. Parametric and procedural modeling
Designers utilize parametric and procedural modeling
tools such as Rhino -Grasshopper, Houdini, and Processing to define the
relationships between the data parameters and geometric changes. The
constraints, iterations, and dependencies are encoded by each algorithm
resulting in a structure that is living and changes depending on variations in
the dataset. There are technologies like lofting, mesh subdivision, Voronoi
tessellation and point-cloud reconstruction to form organic and not a priori
complex surfaces and spatial patterns out of data-driven logic. Machine
learning models can additionally be applied in generative design processes to
discover latent models or to optimize aesthetic settings. The precision and
serendipity created by these computational systems allow designers to improvise
a space of design by searching vast and algorithmically created designs.
4.3. Integration of fabrication technologies
4.3.1. 3D printing
With the use of 3D printing, it is
possible to transform digital models to tangible data sculptures with its high
accuracy and geometric complexity. Additive manufacturing is used to fabricate
forms of an algorithmic nature by layering material, usually resin, PLA or
metal powder, sequentially to build up the desired shape. The method is most
suited to the manufacture of convoluted lattices or organic encodings of
geometries and volumetric data that would not have been possible in a manual
fabrication procedure. 3D printing can also be used to print multi-material and
color data such that categorical or scalar
information can be represented directly in the texture or colour of the
structure. Its easy approach, and also scalability are handy in the exploration of prototypes, as well as in
end sculptural installations. Of significance, 3D printing offers a links data
abstraction and physical representation to offer material mode of computation
in which computational aesthetics are brought to life. The printed edition is a
digital piece of digital intelligence - all the layers are parts of material
documentation of an algorithmic process, that is, it unites information
science, accuracy of the engineering and art intent into a material
representation.
4.3.2. CNC
CNC machines cut substances- be it
wood, metal or foam using information created geometries in order to disclose
spatial structures which possess informational significance. The CNC material
reduction process compared to an additive technique is concentrated on
articulation of surfaces, depth and tactile grain - interaction of mechanical
precision and natural flaw. Parametric toolpaths of designers are designed
using data driven algorithms, in which every cut is dependent on a variable in
a dataset or a spatial relationship. CNC machining is especially most suitable
in large or permanent installations, where physical robustness and textual
articulateness is needed. It allows intricate contouring, multi-axis carving as
well as hybrid assembly with other fabrication techniques. CNC will, therefore,
be a translator and sculptor, bringing computational form to the physical
through very fine control of motion, transposing digital patterns into physical
forms which combine the rigorousness of engineering practice with the
expressiveness of sculptural art.
4.3.3. Laser Cutting
Laser cutting offers a quick and
precise procedure of making planar or modular parts of data sculptures. With a
focused beam of laser, acrylic, wood, or metal sheets are cut, etched or
engraved accurately following algorithmic patterns based on datasets. The
method is skilled at creating stratified, interlocking or grid-based
visualizations regarding two-dimensional information associations where
physical assemblage is recast as a
information association. Laser cutting is commonly used in design by designers
in data stratification, in which every layer corresponds to a time, category,
or statistical dimension. These layers create volumetric illusions- when
stacked or suspended, the data of light, shadow, and translucency are converted
into a spatial composition, a flat data.
5. Technological Ecosystem
5.1. Role of data analytics, machine learning, and pattern extraction
Scientific data transformation Raw data
is converted into structured understanding informative of aesthetic form by
using data analytics and machine learning, which are the main focus of
sculptural data visualization. Precision, relevance and context are guaranteed
with the help of data analytics, and unprocessed numbers can be transformed to
the form of understandable variables that can be coded spatially. Patterns are
formed as a result of descriptive, predictive and exploratory analysis that
forms the conceptual blue print of physical manifestation. Some of the hidden
structures of big or complex data sets are revealed or uncovered using machine
learning like clustering, regression and dimensionality reduction algorithms.
Examples are the principal component analysis (PCA) or t-SNE to cluster
high-dimensional data in useful visual axes which can be then overlaid on
geometric features, like curvature, volume or symmetry. The idea of neural
networks and generative models are also included in the list of creative
variability, and the data may evolve to these expressive forms, that is,
combining the accuracy and unpredictability.
5.2. Parametric and Generative Design Tools
The creative center
of data-sculptural processes is made of parametric and generative design tools
which allow designers to convert datasets into dynamic and adaptable
geometries. Programs like Grasshopper to Rhino, Processing, and Houdini offer
an algorithmic environment where form is created through given relationships,
and not fixed size. In parametric modeling, each
structural element, whether curve, point, or surface will have adjustable
parameters that are associated with data values. This enables the real time
manipulation and the iterative refinement of the design, to make sure that the
evolution of design is as variably represented as the dataset it is based on.
Grasshopper is exceptional in the field of spatial logic and architectural
structuring and allows designers to create direct data-geometry pipelines.
Processing is a visual programming language that is used to create interactive
and generative graphics, which is best suited to exploratory modeling or visual pattern prototyping. Figure 3 demonstrates that adaptive data-sculptural models are
influenced by parametric and generative design tools. The procedural node based system of Houdini is able to
support complex simulations, particle systems and volumetric modeling where data can be used to create organic and fluid
morphology.
Figure 3
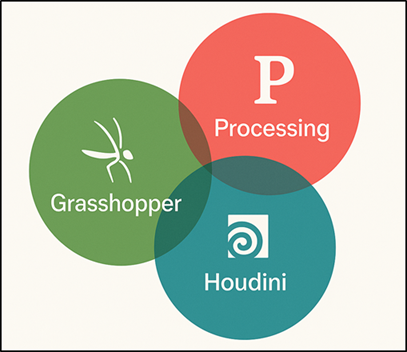
Figure 3 Parametric and Generative Design
Tools in Data-Sculptural Modeling
Collectively, these technologies bring
about generative authorship in which designers are in between algorithmic
intelligence and aesthetic judgment. The process of work turns into a cyclical
process - data is the source of form, form is the source of reinterpretation,
and computation changes itself in response to the former. Coupling logic and
spontaneity, the parametric and generative tools are able to make the design
process an alive system of emergence, able to create sculptures that are
mathematically consistent as well as artistically suggestive, that is to say,
in the rhythm of the data in a form of spatial motion.
6. Aesthetic and Interpretive Dimensions
6.1. Visual storytelling through physical form
In data sculpture, visual narrative is
performed by bringing abstract information to form, texture and space. As
compared to traditional narratives, which depend on text or image, sculptural
storytelling relies on the spatial rhythm, proportion, and touch to convey some
meaning. Every curve, every hollow, or every line turns into a piece of story,
a coded bit of information, which, when combined together, turns into a story
of change, association, or creation. The grouping of elements, gradients and
densities reflect the relationships of time or rank among sets of data, and
convert numerical acts into gestures of symbols. This type of narration
survives on metaphor. The statue of the variation in climate could be waving
like a tide, and the statue of the social networks could be a tree that could
be fractured into some branches. These kinds of symbolism enable information to
be not only understood but also evoked, so that the viewer can experience
patterns, but not read them. The material decisions, to use clear acrylics or
oxidized metals add to the reverberation of the narration, and indicate the
data themes such as transparency, corrosion, or flux. Composition, light and
perspective of the sculpture make it an experiential field of narrative
involving audiences in the interpretive participation. As the viewers navigate
through it, new alignments and visual relationships are created and the
information that was stagnant is dynamic as stories are told. Accordingly, the
sculptural system becomes a multimodal narrative tool as data analysis is
turned into poetic embodiment, and information begins to speak the universal
language of space and sensual perception.
6.2. Cognitive and Emotional Impact on Audiences
The emotional and mental effect of the
data sculptures is determined by the possibility to merge logical understanding
and experience. Contrary to the visualizations found on screens, which favor analytical vividness, physical data representations
entail incorporating more than just one of the perceptual senses: sight, touch,
movement, scale, etc., forming a bodily experience with information. This
multi-sensory interaction enables embodied cognition so that data are processed
in a spatial and intuitively, not abstractly, way by the viewers. As seen in Figure 4, there is a framework of connection of cognitive and
emotional influences in data-sculptural artworks. The brain perceives
proportion, rhythm, and balance as some kind of innate stimulus and transforms
statistical relations into experiences.
Figure 4
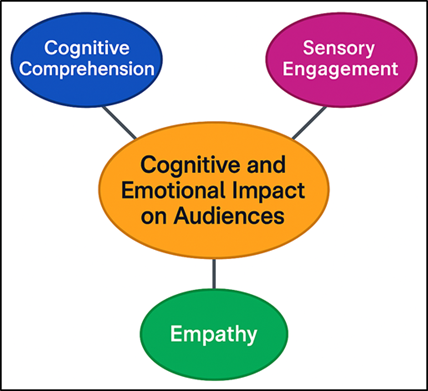
Figure 4 Cognitive and Emotional Impact
Framework in Data-Sculptural Art
Sculptural visualizations have the
emotional power to convert unemotional information into emotional existence. A
curvy and wavy surface can be an expression of growth or peacefulness; the
rough, disorganized shapes can be an expression of war or violence. This
emotional appeal is based on aesthetic empathy, the ability of human beings to
project sensation into perceived forms. The sculpture causes a feeling of
connectivity and relation by placing the viewer into the physical space of the
data, making global datasets, such as the deforestation or migration,
accessible as personal experiences of scale and impact.
6.3. Balancing Abstraction, Accuracy, and Expressive Intent
The paradox of data-sculptural practice
is to effect a ratio between the abstraction, the
accuracy and expressiveness. Total fidelity of information ensures
informational integrity but may produce graphically rigid or impossible
information, and excessive abstraction may result in an absence of meaning. Balance
is an art form that involves the construction of the forms that would be true
to the nature of the dataset and promote the interpretive interaction.
Cognitive intelligibility and aesthetic richness are not sacrificed in the
selective simplification, scaling and metaphorical translation process of
designers. This process of simply viewing complexity in order to perceive
patterns that can be understood in order to make the mind to know about the
general relationships is the abstraction of visual language. Nevertheless,
these abstractions are grounded in accuracy which makes them remain
proportionate, have relational integrity and structural hierarchy to enhance
credibility. The expressive aspect, in its turn, adds human touch to the
sculpture, which is achieved as a result of material symbolism, movement, and
rhythm. This tripartite accord necessitates the refinement process and
precision of calculations is joined with the instinct of art. Algorithms can
achieve quantitative consistency, whereas interpretive hierarchy is maintained
by the designer, and he or she decides the fineness of the data that will take
the lead in the visual narrative.
7. Conclusion
Sculptural art form of data
visualization redefines human perceptions, interpretation as well as
experiences with respect to information. It permeates conventional divisions of
charts, graphs, computer displays in that it brings data to life in the form of
corporeal and spatial narratives that incorporate analytical precision and
beauty. The synthesis of computational modeling,
machine learning, and digital fabrication produces abstract datasets in a
touchable, explorable, and emotionally engaging form to represent them as
sculptural embodiments. A combination of science, technology and art such like
this enables the information to speak more than mind to stimulate feeling,
compassion and thought. It is pointed out in the paper that physicalization
of data is not a visualization process, however, it is a process of translation
and transformation. It decodes numeric logic at a sensual level, between the
spiritual realm of digital information and material realm of material space.
All sculptural manifestations of expression become a dialogue between accuracy
and fantasy and cause the viewers to think about the hidden rhythms of how the
mechanisms structure our reality, society, and emotions. However, it is not an
easy process and fidelity, issues of scale, sustainability and interpretive
ambiguity are still present. However, such limitations also contribute to
resourceful problem solving, which creates cross-disciplinary collaboration of
artists, designers, engineers, and data scientists. The chance of dynamic, interactive
and adaptable sculptures is even increasing with the development of fabrication
technologies.
CONFLICT OF INTERESTS
None.
ACKNOWLEDGMENTS
None.
REFERENCES
Arrighi, G., See, Z. S., and Jones, D. (2021). Victoria Theatre Virtual Reality: A Digital Heritage Case Study and User Experience Design. Digital Applications in Archaeology and Cultural Heritage, 21, e00176. https://doi.org/10.1016/j.daach.2021.e00176
Bekele, M. K., Pierdicca, R., Frontoni, E., Malinverni, E. S., and Gain, J. (2018). A Survey of Augmented, Virtual, and Mixed Reality for Cultural Heritage. Journal on Computing and Cultural Heritage (JOCCH), 11, 1–36. https://doi.org/10.1145/3167132
Ceccotti, H. (2022). Cultural Heritage in Fully Immersive Virtual Reality. Virtual Worlds, 1, 82–102.
El-Said, O., and Aziz, H. (2022). Virtual Tours as a Means to an End: An Analysis of Virtual Tours’ Role in Tourism Recovery Post COVID-19. Journal of Travel Research, 61, 528–548. https://doi.org/10.1177/00472875211024893
Lo
Turco, M., Giovannini, E. C., and Tomalini, A. (2022). Parametric and
Visual Programming BIM Applied to Museums, Linking Container and Content. ISPRS
International Journal of Geo-Information, 11, 411.
https://doi.org/10.3390/ijgi11070411
Luther, W., Baloian, N., Biella, D., and Sacher, D. (2023). Digital Twins and Enabling Technologies in Museums and Cultural Heritage: An Overview. Sensors, 23, 1583. https://doi.org/10.3390/s23031583
Maiwald, F., Lehmann, C., and Lazariv, T. (2021). Fully Automated Pose Estimation of Historical Images in the Context of 4D Geographic Information Systems Utilizing Machine Learning Methods. ISPRS International Journal of Geo-Information, 10, 748. https://doi.org/10.3390/ijgi10120748
Monaco, D., Pellegrino, M. A., Scarano, V., and Vicidomini, L. (2022). Linked Open Data in Authoring Virtual Exhibitions. Journal of Cultural Heritage, 53, 127–142. https://doi.org/10.1016/j.culher.2021.11.002
Nisiotis, L., Alboul, L., and Beer, M. (2020). A Prototype That Fuses Virtual Reality, Robots, and Social Networks to Create a New Cyber–Physical–Social Eco-Society System for Cultural Heritage. Sustainability, 12, 645. https://doi.org/10.3390/su12020645
Pisoni, G., Díaz-Rodríguez, N., Gijlers, H., and Tonolli, L. (2021). Human-Centered Artificial Intelligence for Designing Accessible Cultural Heritage. Applied Sciences, 11, 870. https://doi.org/10.3390/app11030870
Pourmoradian, S., Farrokhi, O. S., and Hosseini, S. Y. (2021). Museum Visitors’ Interest on Virtual Tours in COVID-19 Situation. Journal of Environmental Management and Tourism, 12, 877–885.
Rahaman, H., Champion, E., and Bekele, M. (2019). From Photo to 3D to Mixed Reality: A Complete Workflow for Cultural Heritage Visualisation and Experience. Digital Applications in Archaeology and Cultural Heritage, 13, e00102. https://doi.org/10.1016/j.daach.2019.e00102
Rauschnabel, P. A., Felix, R., Hinsch, C., Shahab, H., and Alt, F. (2022). What Is XR? Towards a Framework for Augmented and Virtual Reality. Computers in Human Behavior, 133, 107289. https://doi.org/10.1016/j.chb.2022.107289
Theodoropoulos, A., and Antoniou, A. (2022). VR Games in Cultural Heritage: A Systematic Review of the Emerging Fields of Virtual Reality and Culture Games. Applied Sciences, 12, 8476. https://doi.org/10.3390/app12228476
Willkens, D. S., Haley, H. M., and Liu, J. (2020). Race, Space, and Digital Interpretation at Selma’s Old Depot Museum. Arris, 31, 108–118.
|
|
 This work is licensed under a: Creative Commons Attribution 4.0 International License
© ShodhKosh 2025. All Rights Reserved.