ShodhKosh: Journal of Visual and Performing ArtsISSN (Online): 2582-7472
|
|
Data Visualization as Artistic Expression
Nitin Sharma 1![]()
![]() ,
Sudeshna Sarkar 2
,
Sudeshna Sarkar 2![]()
![]() , Akhilesh Kumar Khan 3
, Akhilesh Kumar Khan 3![]() , Shilpa Bhargav 4
, Shilpa Bhargav 4![]()
![]() , Karthik K 5
, Karthik K 5![]()
![]() ,
Prince Kumar 6
,
Prince Kumar 6![]() , Amrut
Ramchandra Pawar 7
, Amrut
Ramchandra Pawar 7![]()
1 Centre
of Research Impact and Outcome, Chitkara University, Rajpura- 140417, Punjab,
India
2 Assistant
Professor, Department of Management, ARKA JAIN University Jamshedpur,
Jharkhand, India
3 Greater Noida, Uttar Pradesh 201306,
India
4 Associate Professor, Department of
Design, Vivekananda Global University, Jaipur, India
5 Assistant Professor, Department of
Computer Science and Engineering, Aarupadai Veedu
Institute of Technology, Vinayaka Mission’s Research Foundation (DU), Tamil
Nadu, India
6 Associate Professor, School of
Business Management, Noida International University, Greater Noida, Uttar
Pradesh, India
7 Department of CSE (AIML), Vishwakarma
Institute of Technology, Pune, Maharashtra, 411037 India
|
|
|
ABSTRACT |
|
|
The data
visualization has not only become a more communicative, rather than an
aesthetic practice, but also rather an artistic one, where datasets can cease
to be the input of information, but a resource of expression that might
elicit an emotional reaction, a story, and a cultural background. The paper
will consider data visualization as an art form by following the history and
theoretical context of data visualization beginning with the early scientific
diagrams and the art of cartography to the Bauhaus inspired
minimalism and the emergence of computational data art. Under this outlook,
data becomes something manipulable, decontextualized, or repackaged so as to generate metaphor, critique systems or provoke
sensory engagement. The aesthetics such as theory of color, psychology of
perception, composition and generative form-making are discussed and how
artists use geometric, organic and algorithmic formations to make readings,
which are not so abstract that they cannot be interpreted, look appealing to
the eye. The current processes are shifting towards creative code,
interchangeable systems and generative models run on AI in
order to offer a hybrid form of artistic practice that integrates both
the customary practice and the
sophisticated computational approaches. The paper will be based on the
exploration of how cross-disciplinary collaborations between artists,
scientists and technologists can enhance the expressive potential of data
through the study of landmark data-art projects in museums, galleries and
in-the-street installations. Along these processes, the paper outlines key
concerns that are associated with data ethics, representational imprecision,
scalability challenges, and the viability of digital artworks with the
passage of time. |
|||
|
Received 30 April 2025 Accepted 02 September 2025 Published 25 December 2025 Corresponding Author Nittin Sharma, nittin.sharma.orp@chitkara.edu.in
DOI 10.29121/shodhkosh.v6.i4s.2025.6848 Funding: This research
received no specific grant from any funding agency in the public, commercial,
or not-for-profit sectors. Copyright: © 2025 The
Author(s). This work is licensed under a Creative Commons
Attribution 4.0 International License. With the
license CC-BY, authors retain the copyright, allowing anyone to download,
reuse, re-print, modify, distribute, and/or copy their contribution. The work
must be properly attributed to its author.
|
|||
|
Keywords: Data Art; Creative Coding; Generative Aesthetics;
Visual Abstraction; Computational Creativity; Information Design |
|||


1. INTRODUCTION
The classical perspective of data visualization has been appropriated as a functional area, an analytic practice, which is concerned with transforming a multifaceted data set into an acceptable graphic. Nevertheless, in recent decades this discipline has become significantly larger than the utilitarian origins of computing as an art form, which uses aesthetics, computation and critical thinking. A paradigm of arts of data visualization is where data is not simply displayed to be read, but is made, modeled, and re-conceived to give an emotional, cultural, and philosophical message. Rather than a clear window into the figures that it contains, data visualization is a fruitful space of creative negotiation as designers and artists generate sensory experiences, patterns of narrative, and echoes of symbolism. The gesture is suggestive of broader cultural and technological transformation in the age of the big data, algorithmic culture and ubiquitous online media in which data is increasingly a more significant factor in how societies perceive systems, behaviour and identities. The causes of development of this art are similar traditions. Scientific graphs, cartography and information art were initially used and laid a foundation of principles of transforming observations into images Staessen and Boelens (2023). Movements such as Bauhaus, minimalism, and contemporary graphic design were also mentioned as an example of what can be done with the form, color, and composition when expressing conceptual ideas without losing clarity and balance. As computation became available to artists, information began to be seen not only as a source of truth, but as a pliable medium which may be employed to aid generative aesthetic, procedural form and an interactive experience. In the contemporary environment of artists, datasets of different types, which can include environmental measurements, social media traces, biometric signals, and so forth, are now seen as being narrative and affective entities in broad cultural stories. An expression such as rebranding information is in agreement with the latest arguments on using aesthetics in the information design Kodaira et al. (2023). The conventional visualization is founded on accuracy, legibility and usability; the artistic visualization is a prefiguration of feeling, indistinctness and subjective clarification. The contradiction between these paradigms is inviting as to the exploration of the same: How can the hidden sounds be represented by abstraction? Does the process of distortion or exaggeration help to enlighten subjective experiences? What are the activities in instances where the artists transform the real-life information to be speculative or poetic versions? The conceptual knowledge of data analytics and artistic visualization are incorporated in Figure 1. These questions reveal the two-sidedness of data visualizations since it is a model of representation and a piece of art.
Figure 1
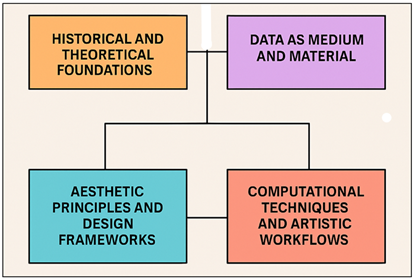
Figure 1 Conceptual Framework of Data Visualization as Artistic
Expression
Computational technologies have a strong impact on the modern reality of data-driven art. Generative and interactive forms have been brought to mass democracy with creative coding frameworks, including Processing, p5.js, TouchDesigner, and D3.js. Using machine learning, GANs, and large-scale simulation systems, new forms of storytelling become possible in which patterns are synthesized, reinterpreted, or imagined based on the original dataset Hrinchenko et al. (2023). Algorithms based on interventions, both deterministic and stochastic and AI assisted, allow artists to experiment with emergent behavior, dynamic pattern plurality and multimodality in visual, auditory and spatial space. These abilities confuse the lines between art, science and design and bring about interdisciplinary partnerships that redefine the cultural imagination.
2. Historical and Theoretical Foundations
2.1. Early scientific diagrams, cartography, and information art traditions
The history of data visualization as artistic practice goes back to the ancient scientific diagramatic innovations, the cartographic experimentation, and the proto-information art practices that combined both the element of empirical observation and the intention of beauty. Earlier scientific illustrators like Leonardo da Vinci, Robert Hooke and Andreas Vesalius drew technically correct but attractive diagrams with composition, shading and proportion used to facilitate their interpretation. Likewise, the medieval and Renaissance cartographers created rich maps, combining the geography, mythology, and symbolic decoration, proving that the visual representation of the information never took any other dimensions but cultural and artistic Hrinchenko et al. (2024). These artifacts of the history can reflect on a spectrum where clarity of information is accompanied by the ornamentation of expression. In the 19th century Charles Joseph Minard, Florence Nightingale, and William Playfair pioneered the development of statistical graphics and demonstrated how complicated social and economic trends might be reduced to a simple visual form. Their works provided the theoretical basis of modern visualization with its focus on narrative, geometry, and visual reasoning. Simultaneously with these trends, early information art did manifest itself in diagrammatic experimentation in design, architecture, and education, such as Otto Neurath in his ISOTYPE system, a visual and intuitively communicative system using pictograms to visualize social data Kawala-Sterniuk et al. (2021).
2.2. Influence of Bauhaus, Minimalism, and Modern Design Movements
The Bauhaus, minimalism and the further modern design movements had a tremendous influence on the visual languages used to inform contemporary data-art practices. At the Bauhaus artists and designers focused more on combining form and functionality, on geometric accuracy, balance and reducing visual material to fundamental structures. Wassily Kandinsky and Laszlo Moholy-Nagy are masters of the Bauhaus who studied the expressive power of line, color and geometry with ideas that are very close to generative and algorithmic aesthetics of visualization Tairov et al. (2024). Minimalism, which arose in the middle of the 20th century, contributed to the further development of the concept of visual reduction in terms of enhancing conceptual depth. Repetition, grids, and systemic structures were employed by such artists as Sol LeWitt and Agnes Martin to produce art that is based on logic and composition using rules. Their procedures resemble the modern algorithmic procedures as datasets are translated to the patterns via systematic operations. Meanwhile, the contemporary graphic design (Swiss typography to information architecture) perfected the concepts of hierarchy, readability, and the spatial balancing, which affects the way artists and designers build data-driven compositions Makurin (2023). There was a cumulative theoretical and aesthetic ground that was added by these movements focusing on formal purity, systemic thinking and expressive power of abstraction.
2.3. Emergence of Data Art within Digital Culture and Computational Aesthetics
The appearance of data art can not be discussed without references to the increase of the digital culture and computational aesthetics, which changed the way information is generated, read, and resourcefully processed. With the advent of computers as a key to scientific studies, communication and the daily life of people, massive amounts of data were now accessible to artistic investigation. This recent proliferation of information in a machine-readable form allowed artists to leave behind the passive representational and proceed to energetic, interacting and generative modes of expression Kaminsky et al. (2023). The early computer art pioneers (Frieder Nake, Vera Molnár, and Manfred Mohr) established the foundation by showing that an aesthetic structure could be created through the use of algorithms, and a symbiosis between the process of computation and art became evident. Themes of surveillance, social media, environmental sensing, and algorithmic governance were also started to be predicted by digital culture, which encouraged artists to become critical of the systems that gave rise to and formed data Demianchuk et al. (2021). Table 1presents the significant studies that have connected data visualization process with an artistic expression. Data art therefore became not only an exploration of pattern, colour, and form in its own right but also a conceptual practice that aims to answer not only political but also social and environmental questions. Computational aesthetics brought new ways of conceptualizing the concept of representation: the idea of emergence, complexity, and non-linearity.
Table 1
|
Table 1 Summary on Data Visualization as Artistic Expression |
|||
|
Domain |
Dataset Type |
Technical Tools |
Challenge |
|
Human-centered
data storytelling |
Mobility data, social
datasets |
Processing, custom
algorithms |
Limited scalability for
massive datasets |
|
Data humanism, personal data |
Diaries, interviews, qualitative logs |
Illustrator, custom data schemas |
Labor-intensive; limited automation |
|
Socio-cultural pattern
visualization Xu and Wang (2021) |
Behavioral, demographic datasets |
D3.js, custom visualization
frameworks |
High complexity in
maintaining interpretability |
|
AI-driven immersive data art |
Climate, architecture, neuroscience data |
GANs, ML models, Unreal Engine |
Computationally expensive; hardware dependency |
|
Google data visualization Chowdary et al. (2023) |
Search, text, collective
digital traces |
Java, web visualization
tools |
Limited artistic abstraction
due to platform constraints |
|
Collective creativity, digital crowds |
Crowdsourced drawings, flight paths |
Processing, WebGL |
Data quality depends on user participation |
|
Environmental and
weather-based sculpture Kim et al. (2020) |
Meteorological datasets |
Handcraft + data modeling |
Low resolution for highly
granular datasets |
|
Sound–data abstraction Mancini et al. (2018) |
Scientific + mathematical datasets |
Max/MSP, custom code |
Intentionally opaque; low interpretability |
|
Algorithmic data aesthetics |
Motion, biological, social
data |
OpenFrameworks, ML, simulations |
Requires high computational modeling skill |
|
Critical visualization studies Tian et al. (2020) |
Geopolitical, network data |
D3.js, network analysis tools |
High abstraction may confuse general audiences |
|
Cultural pattern analysis |
Image datasets, social
media, films |
Python, ImagePlot,
ML |
Requires massive dataset
preprocessing |
|
Personal and literary data art |
Textual corpora, personal logs |
Handcrafted + digital workflows |
Limited scalability for large datasets |
|
Public interactive data art Grigoryan and Agaian (2019) |
Urban data, sensor streams |
TouchDesigner, Kinect, IoT feeds |
Needs continuous maintenance
and calibration |
3. Data as Medium and Material
3.1. Conceptual framing of data as narrative, metaphor, and aesthetic substance
In visualization of art, data is not only informational matter, but also a substance, which, according to new forms of visualization, can be molded into narrative, metaphoric and aesthetic experiences. Artists look to data as a raw material similar to pigment, clay or sound, with some kind of underlying histories, relationships and patterns. Having been formed by means of visual composition, the data can narrate the stories regarding human behavior, environmental change, cultural dynamics, or personal memory. Triadic model in Figure 2 relates the narrative, metaphorical and aesthetic roles of data. This narrative capability enables data-driven artworks to be able to resonate emotionally and simultaneously stay in touch with their underlying realities.
Figure 2

Figure 2 Triadic Representation of Data’s Narrative, Metaphorical,
And Aesthetic Roles
In addition to telling stories, data has metaphorical functions so that artists can map the numbers structures onto the conceptual topics in a broad sense. As an example, networks can be used to represent social entanglement, emotional dynamic as waveforms or temporal data sets as cycles of loss and renewal. These metaphoric applications indicate the elastic nature of data interpretation to enable artists to fill computational structures with poetry Grigoryan and Agaian (2019a).
3.2. Types of Datasets Commonly Used in Artistic Visualizations
The artistic visualizations are based on a massive amount of datasets, some of which are selected due to their richness in information and others are selected because of their ability to express. Structured patterns in quantitative datasets, like climate data, financial data, demographic data, sensor data, etc., tend to be generative and are a dossin to take the shape of regenerative forms, rhythmic design, geometry, etc. Such datasets usually give us macro-level accounts of the systems in society, change in the environment or technology structures. The qualitative and textual data, such as social media posts, historical records, interviews, and literary corpora, allow artists to discover a theme of identity, memory, and cultural discourse Grigoryan and Agaian (2019b). Textual data may be converted through natural language processing or semantic mapping to visual textures, spatial constellations or algorithmic patterns that are indicative of some underlying emotional or thematic currents. Intimate and embodied Biometric and physiological data (heartbeat rhythms, traces of movement, EEG, or DNA sequences) bring about intimate and bodily data art. Such forms add to possibilities of narrative by connecting the physical experience with the visual expression.
3.3. Ethical Considerations in Artistic Data Representation
Ethical issues become key aspects of the data-driven artistic practitioner because the artworks that may be created as a result of information flow are often based on either people, communities, or sensitive systems. The most basic issue is the consideration of privacy: artists should be sure that identifiable or personal data is anonymized, their consent is not compromised, and the weak ones are not revealed in artistic interpretation. Ethical usage of data, even in publicly available cases, requires considerate analysis of circumstances, potential harm and perceptions of the audience. The second issue is associated with misrepresentation. Creative abstraction may cause the erosion of traces, constraints, or subtleties of data, which may further support a false belief or prejudice. Artists have to balance between the freedom to be creative and the responsibility to make sure that distortions are done to achieve some conceptual goals, but not to confuse the audience. It is also important to deal with bias of data since datasets tend to reproduce structural inequalities; the artwork must recognize or challenge these tendencies instead of blindly reproducing them. Another important factor is cultural sensitivity. When artists are working with data that is a representation of a community, histories, or social struggles, they should treat the information with respect and not aestheticize the trauma or strip history and context away. The transparency (documentation, notes on the processes, or framing of the context) can assist the audiences in interpreting how and why some changes to art occurred.
4. Aesthetic Principles and Design Frameworks
4.1. Color theory, composition, texture, and perceptual psychology
The principles of aesthetics are primary in the creation of data-driven artworks, influencing the way of how the audience thinks and feels about the information presented in the visual form. Color theory is a factor of mood, hierarchy and interpretative features; color artists rely on harmonies, contrast, and gradations to create atmosphere or emphasize considerations of structure in data. Warm colors can be used to express energy or immediacy, and cooler colors can be used to express composure, aloofness or abstraction. Color coding is also a source of readability and it must be carefully calibrated to allow the visual richness without overloading the informational clarity. Composition/space distribution of visual elements- the flow of narrative and visual effects of data art are determined. Artists also use symmetry, asymmetry, balance, and the focus point to coordinate the attention and bring about rhythm to the canvas or digital interface. Simulated texture or based on the density of the data varies as a means of adding depth and touch and converting raw numbers into sense experience. Complexity or uncertainty can be reinforced by the layers of textures whereas the gradients can be smooth and may be used to indicate continuity or flow. The psychology of perception enlightens viewers on the interpretation of patterns, shapes and relations.
4.2. Mapping Strategies: Geometric, Organic, Generative, and Algorithmic Forms
Mapping strategies define the conversion of raw data into visual form, the aesthetics of language and power of expression of an artwork. Geometric mappings employ geometric shapes (i.e. points, lines, grids, polygons) to provide information with the structural accuracy. The style focuses more on mathematical relations, symmetry and order, which is why it is a suitable match in visualizations that possess an architectural structure, cartography and modernist aesthetics. Geometric shapes in most instances tend to be equated with certain stability and legibility, and it enables the artists to discover hidden patterns in the systemic sets of data. The organic mappings bring fluidity, irregularity and metaphors to the biology. Data could be represented in the shape of running lines, tree-like patterns or cellular cloths reminding a person of such natural organisms as rivers, living beings or natural environments.
Figure 3

Figure 3 Multi-Form Mapping Approaches in Data Art
Visualization
The style is preoccupied with the naturalness of life and emotionality, which transforms numeric patterns into the landscapes of expression and formation. Figure 3 comprises different mapping approaches that are employed to form visual structures in data art. Generative mappings are premised on the changes of the rules and stochastic dynamics, which allow the data to be influencing new patterns of emergence or algorithmic growth. Artists achieve a visual that accumulates based on the underlying datasets and, however, retains aesthetic unpredictability through randomness, feedback loops or agent based dynamics.
4.3. Balancing Artistic Abstraction with Interpretative Clarity
The issue of striking a balance between abstraction and clarity is one of the principal concerns of data-driven artistic visualization since artists must resolve the dilemma of the freedom of expression and significant representation. The artistic tool abstraction allows the information to transcend its literal meaning and seek an emotional response, imaginative theorization, and theory. Abstraction can either reflect some underlying theme, or some hidden dynamic; or create an atmosphere that transcends unadulterated numerical form, by distortion, simplification or metaphorical change. However, excessive abstraction can result in lack of sensitivity to the origins of data by the art, which can be disorienting to viewers or artificial representation of the phenomena represented. Interpretative clarity is, however, applied to ensure the viewers are able to find meaningful relationships, patterns or stories in the visualization. Clarity does not mean an artistic sterility; on the contrary, it provides a point of reference and this leads the viewers to place themselves in perspective relative to the visual field. Artists do this through strategic choices with regard to scale, labeling, contrast of colours, geometry and interactive indicators that reveal underlying logic of the data. The issue is to create a visual language which would retain the conceptual truth and furnish aesthetic riches. Many data artists often apply layered strategies to form an original perception of an abstract image with interactive or add-on elements that help to increase understanding. Others use symbolism or regular mapping conventions in order to facilitate coherence.
5. Computational Techniques and Artistic Workflows
5.1. Visualization libraries, creative coding, and interactive platforms
Computational art has mainly replaced the need for human skills in the production of modern data-driven art, providing artists with a richness of visualization libraries, artistic coding systems, and interactive versions. The technical basis of converting raw data to moving visual structure is libraries like D3.js, Plotly, and Three.js that allow finely adjusting geometry, color, movement, as well as user interaction. Their plasticity enables artists to circumvent the conventions of default and constitute massively customized aesthetic experiences. The workflow of these platforms is based on sketching and enables artists to quicken their tryouts and experiment with arising patterns guided by algorithmic actions. They also help in multimedia integration which allows integration of visual data with sound, movement and environmental inputs. Interactive platforms also widen the potential of art by turning the immobile visualization into the responsive and immersive one.
5.2. Use of AI, GANs, and Machine Learning in Generative Data-Art Systems
Expressiveness Generative Adversarial Networks (GANs) are another step in expanding the range of expressiveness and generate textures, patterns or visual worlds as a whole of learned distributions. GANs have the ability to generate hybrid in the form of a data-driven structure mixed with creative variation when trained on curated datasets; satellite imagery, handwriting, or sound waves. This reality-computational fantasy gives artists the opportunity to challenge the authenticity, program futures, or come up with speculative images of the invisible space. Generative systems based on AI are also used to generate interactive artworks that respond to viewers or changing data streams. Learning through reinforcement or the agent-based models can produce those actions in response to the real-time available environment to produce living visual ecosystems formed by data.
5.3. Hybrid Workflows Integrating Traditional Art Practices with Digital Pipelines
The hybridistic artistic workflows combine the haptic expressiveness of the traditional art practice and the accuracy and adaptability of the digital pipelines to develop multifaceted to the approaches towards the data-driven creativity. Most artists start by sketching or painting or making marks on paper to experiment with compositions and emotional moods and then transfer these components into the digital space. These physical art objects can be scanned, vectorized or sampled using an algorithm to use as scaffolds or as textures to perform and then data-driven transformations. Figure 4 illustrates workflow connecting analog processes with electronic production processes in arts. On the other hand, artists can also apply computational procedures in creating forms that are then realized through conventional methods.
Figure 4
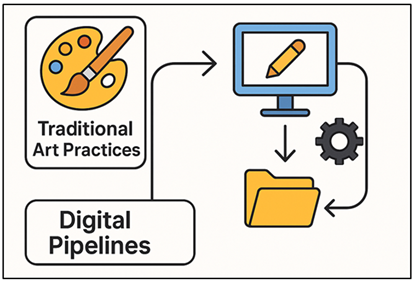
Figure 4 Process Flow of Hybrid Artistic Production Using
Analog and Digital Methods
As an example, patterns algorithmically generated can be built in real physical media, like printmaking, textile weaving, ceramics, or sculpture, by CNC machining, laser cutting, or 3D printing. This ping and pong between the virtual and the physical makes the data art even more material, basing the computational aesthetics on human touch and craft. Mixed-reality installations with physical objects and digital projections interacting with each other can also work with the hybrid workflows. Artists incorporate sensors or robotics or environmental data feeds into works of art that become responsive and change between material and virtual states.
6. Case Studies of Data-Driven Artistic Expression
6.1. Analysis of landmark works by major data artists and studios
Masterpieces by the key data artists and studios demonstrate the power of expression of the data visualization process and the possibility to transform the modern artistic disc. Individual artists like Jer Thorp, Giorgia Lupi, Moritz Stefaner, and studios like Refik Anadol Studio have been on the forefront of unique styles that merge narrative, computational and aesthetic exploration. The works of Jer Thorp tend to turn abstract data, like human movement or the astronomical information, into the space narrative, which emphasizes relational and time-based movements. The fact that he focuses on the human-centered data redefines the idea of visualization as an instrument of empathy and self-reflection. Giorgia Lupi, cofounder of Accurat, is the proponent of data humanism, as she employs careful, hand-designed systems of visualization to highlight the emotional and cultural aspects of personal and social information.
6.2. Evaluation of Museum, Gallery, and Public-Installation Data Artworks
The personal data stories, environmental data collections, or social-political issues are often the subject of gallery exhibits, prompting the viewer to consider the connection between information systems and themselves. Installations in the public also bring the data art out into the community. Massive screen images, interactive screens, media-facades and sensor-based artworks transform real-time data, including weather conditions, movement patterns in the city or the emotions of the group, into immersive visual space. These installations tend to attract various audiences and convert the most ordinary communal spaces into spaces of collective thought. Data is visible and visceral because of their size and engaging level of interaction, which increases the emotional resonance. The analysis of such art pieces would include such aspects as aesthetic effect, conceptuality, communication with the audience, and technological strength.
6.3. Cross-Disciplinary Collaborations Between Scientists and Artists
Scientific-artistic practices have taken on an overwhelming significance to the evolution of the data-driven artistic practice, as they result in the establishment of the environment where both analytical rigor and creativity meet. Scientists are experts and data literate in a field, and artists are sensitive, aesthetically creative and able to place multifaceted ideas into perspective through visual narrative. This complementary effect enhances the expressive and conceptual potential of the artworks of data. The examples of such partnerships include climate science, neuroscience, astrophysics, genomics and urban informatics. One example is the collaboration of artists and climatic researchers to use the data of climate to build immersive architectures, which are interrelated to the ecological urgency rather than the traditional chart or report. Neuroscience interactions can have visualizations of brain activity or mental process, including the combination of scientific intuition and explanatory metaphors to put processes that are otherwise invisible in view. Such unions also utilize the shared computational facilities, such as simulations, machine learning and real-time sensing systems, which generate artworks in the ethos of scientific integrity and artistic experimentation. This type of collaboration is increasingly being supported by workshops, residencies and academic laboratories, which have learned the strength of such interactions both in improving popular knowledge of scientific matters and also in broadening the boundaries of creative practice.
7. Conclusion
Data visualization is represented in art in a significant interwovenness of analytical and aesthetic curiosity and culture. As the societies generate greater and larger amounts of data than ever before, artists have taken this raw resource not only as it is a code that may be broken but also as it is a medium that may be not only emotionally and narrative full but also philosophically full. With the help of the old visualization techniques, recent design patterns and computational aesthetics, data-driven artworks assume that data is not neutral it bears narratives, trends, and human paths that can be revealed, criticized, or transformed through the visual expression. Creative programming, AI algorithms and interactive systems have enhanced the leisure of expressiveness of the artists and have created dynamic, responsive, interactive productions that transcend the range of the fixed representation. Not only can such technologies enhance the arts, but they can also alter the space of thought that visualization occupies such that data would become performative, multisensory and participatory. At the same time, it is possible to employ hybrid working processes that involve the tradition of art and digital pipelines to ensure that data art does not become lackluster and devoid of human touch based on a computational system that rests on bodily creativity. Nevertheless, the discipline is facing severe problems concerning bias, representational integrity, technical limitations and negotiating the archival problems within a dynamic technological world. These problems indicate the necessity of an inter-disciplinary discussion between the artists, designers, technologists and scientists whose integration continues to provide fresh knowledge, methods and aesthetic possibilities.
CONFLICT OF INTERESTS
None.
ACKNOWLEDGMENTS
None.
REFERENCES
Chowdary, M. K., Nguyen, T. N., and Hemanth, D. J. (2023). Deep Learning-Based Facial Emotion Recognition for Human–Computer Interaction Applications. Neural Computing and Applications, 35, 23311–23328. https://doi.org/10.1007/s00521-021-06012-8
Demianchuk, M., Koval, V., Hordopolov, V., Kozlovtseva, V., and Atstaja, D. (2021). Ensuring Sustainable Development of Enterprises in the Conditions of Digital Transformations. E3S Web of Conferences, 280, Article 02002. https://doi.org/10.1051/e3sconf/202128002002
Grigoryan, A. M., and Agaian, S. S. (2019). Evidence of Golden and Aesthetic Proportions in Colors of Paintings of the Prominent Artists. IEEE MultiMedia, 27(1), 8–16. https://doi.org/10.1109/MMUL.2019.2908624
Grigoryan, A. M., and Agaian, S. S. (2019a). Evidence of Golden and Aesthetic Proportions in Colors of Paintings of the Prominent Artists. IEEE MultiMedia, 27(1), 8–16. https://doi.org/10.1109/MMUL.2019.2908624
Grigoryan, A. M., and Agaian, S. S. (2019b). Asymmetric and Symmetric Gradient Operators with Application in Face Recognition in Renaissance portrait Art. In Mobile Multimedia/Image Processing, Security, and Applications (Vol. 10993,114–125). SPIE. https://doi.org/10.1117/12.2518364
Hrinchenko, H., Didenko, N., Burbyga, V., Lesina, T., and Medvedovska, Y. (2024). Ensuring Sustainable Education Through the Management of Higher Education Quality Indicators. E3S Web of Conferences, 558, Article 01029. https://doi.org/10.1051/e3sconf/202455801029
Hrinchenko, H., Trishch, R., Mykolaiko, V., and Kovtun, O. (2023). Qualimetric Approaches to Assessing Sustainable Development Indicators. E3S Web of Conferences, 408, Article 01013. https://doi.org/10.1051/e3sconf/202340801013
Kaminsky, O., Koval, V., Yereshko, J., Vdovenko, N., Bocharov, M., and Kazancoglu, Y. (2023). Evaluating the Effectiveness of Enterprises’ Digital Transformation by Fuzzy Logic. In Advances in Soft Computing Applications (75–90). River Publishers. https://doi.org/10.1201/9781003425885-4
Kawala-Sterniuk, A., Browarska, N., and Al-Bakri, A. (2021). Summary of Over Fifty Years with Brain–Computer Interfaces: A Review. Brain Sciences, 11(1), Article 43. https://doi.org/10.3390/brainsci11010043
Kim, K. H., Park, K., Kim, H., Jo, B., Ahn, S. H., Kim, C., Kim, M., Kim, T. H., Lee, S. B., and Shin, D. (2020). Facial Expression Monitoring System for Predicting patients’ Sudden Movement During Radiotherapy Using Deep Learning. Journal of Applied Clinical Medical Physics, 21(6), 191–199. https://doi.org/10.1002/acm2.12945
Kodaira, A., Xu, C., Hazama, T., Yoshimoto, T., Ohno, K., Mitsuhori, S., Sugano, S., Cho, H., Liu, Z., and Keutzer, K. (2023). StreamDiffusion: A Pipeline-Level Solution for Real-Time Interactive Generation (arXiv:2312.12491). arXiv.
Makurin, A. (2023). Technological Aspects and Environmental Consequences of Mining Encryption. Economic and Ecological Socium, 7, 61–70. https://doi.org/10.31520/2616-7107/2023.7.1-6
Mancini, G., Biolcati, R., Agnoli, S., Andrei, F., and Trombini, E. (2018). Recognition of Facial Emotional Expressions Among Italian Pre-Adolescents, and Their Affective Reactions. Frontiers in Psychology, 9, Article 1303. https://doi.org/10.3389/fpsyg.2018.01303
Staessen, A., and Boelens, L. (2023). Framing Daily Life in Sprawl: Flanders Urbanized Space from a Cinematic Perspective. European Planning Studies, 31(4), 621–640. https://doi.org/10.1080/09654313.2022.2114317
Tairov, I., Stefanova, N., Aleksandrova, A., and Aleksandrov, M. (2024). Review of AI-Driven Solutions in Business Value and Operational Efficiency. Economic and Ecological Socium, 8, 55–66. https://doi.org/10.61954/2616-7107/2024.8.3-5
Tian, Y., Suzuki, C., Clanuwat, T., Bober-Irizar, M., Lamb, A., and Kitamoto, A. (2020). KaoKore: A Pre-Modern Japanese Art Facial Expression Dataset (arXiv:2002.08595). arXiv.
Xu, S., and Wang, Z. (2021). Diffusion: Emotional Visualization Based on Biofeedback Control by EEG. Artnodes, (28), 1–11. https://doi.org/10.7238/artnodes.v0i28.385717
|
|
 This work is licensed under a: Creative Commons Attribution 4.0 International License
© ShodhKosh 2024. All Rights Reserved.