ShodhKosh: Journal of Visual and Performing ArtsISSN (Online): 2582-7472
|
|
Predictive Analytics for Photo Exhibition Planning
Dr. Shakti Prakash Jena 1![]()
![]() ,
Dr. Mercy Paul Selvan 2
,
Dr. Mercy Paul Selvan 2![]()
![]() ,
Manpreet Singh 3
,
Manpreet Singh 3![]()
![]() ,
Dr. Sweta Kumari Barnwal 4
,
Dr. Sweta Kumari Barnwal 4![]()
![]() ,
Om Prakash 5
,
Om Prakash 5![]() , Pooja Abhijeet Alone 6
, Pooja Abhijeet Alone 6![]()
1 Associate
Professor, Department of Mechanical Engineering, Siksha 'O' Anusandhan
(Deemed to be University), Bhubaneswar, Odisha, India
2 Professor,
Department of Computer Science and Engineering, Sathyabama Institute of Science
and Technology, Chennai, Tamil Nadu, India
3 Centre of Research Impact and Outcome, Chitkara University, Rajpura-
140417, Punjab, India
4 Assistant Professor, Department of Computer Science and IT, ARKA JAIN
University Jamshedpur, Jharkhand, India
5 Associate Professor, School of Business Management, Noida International
University 203201, India
6 Department of Engineering, Science and Humanities Vishwakarma
Institute of Technology, Pune, Maharashtra, 411037, India
|
|
|
ABSTRACT |
|
|
Predictive
analytics has become an innovative feature of cultural institutions and other
creative industries that will allow them to plan and optimize the experience
of the exhibition based on the data. This paper introduces a predictive
modeling system specifically designed to be used in the planning of the photo
exhibition, which incorporates previous attendance trends, demographic
factors, is an audience response metric, social media interactions, and
ticketing transactions into a single analytical chain. The suggested system
conducts the severe data preprocessing, including noise reduction, outlier
correction, and normalization as well as the multiple level feature
engineering to create the robust predictors of visitor attendance, the
engagement level, the distribution of the dwell time, and revenue streams.
Several algorithmic paradigms are considered, such as the Linear Regression,
the Random Forest, the XGBoost, the LSTM, and the
ARIMA forecasting each optimized by systematic
hyperparameter tuning strategy. Incorporating both the temporal and
behavioral and environmental features, the framework improves the predictive
accuracy and understandability of forecasts that are necessary in the
exhibition schedules, content management and staff management needs,
marketing segmentation, and spatial arrangement planning. Experimental
evidence shows that tree-based ensemble algorithms, as well as hybrid
architecture of deep learning, significantly outperform classical baselines,
especially in the context of a nonlinear visitor behavior and dynamically
changing preferences of the audience. |
|||
|
Received 05 April 2025 Accepted 10 August 2025 Published 25 December 2025 Corresponding Author Dr.
Shakti Prakash Jena, shaktijena@soa.ac.in DOI 10.29121/shodhkosh.v6.i4s.2025.6837 Funding: This research
received no specific grant from any funding agency in the public, commercial,
or not-for-profit sectors. Copyright: © 2025 The
Author(s). This work is licensed under a Creative Commons
Attribution 4.0 International License. With the
license CC-BY, authors retain the copyright, allowing anyone to download,
reuse, re-print, modify, distribute, and/or copy their contribution. The work
must be properly attributed to its author.
|
|||
|
Keywords: Predictive Analytics, Photo Exhibitions, Visitor
Forecasting, Audience Engagement, Machine Learning Models, Cultural Analytics |
|||


1. INTRODUCTION
Photo exhibitions have a special status in the world of creative and cultural spheres and are both artistic work and space of experiences that appeal to a wide range of individuals. The quality of visual content is not the only factor that determines their success, but also the strategic planning and operational management that will form the basis of the exhibition lifecycle. With the shift in visitor expectations and heightened competition over cultural attention, cultural managers, event planners, and curators are finding data-driven tools to be a growing necessity to predict and manage behavior of the audience, allocate resources, and increase experiences. Rigorous and scalable Predictive analytics is an alternative to make informed decisions in this area using innovations in machine learning, deep learning, and time-series modeling. Predictive analytics redesigns the nature of the design, schedule, and management of exhibitions by converting heterogeneous data sources, such as the historical attendance records to social media engagement patterns, to actionable forecasts Lu et al. (2021). Historically, planning of photo exhibition has been greatly dependent on intuition, professional judgment and post facto analysis. Although these methods give useful information, they have their limitations in terms of predicting changes on visitor attendance, forecasting the level of engagement, or knowing the operational needs in the dynamic cultural and social settings. Besides, digital contacts, virtual exposure, and tendencies that quickly change across websites are increasingly shaping the preference of the audience. This complexity requires computational methods that can possibly represent relationships of time, nonlinear relationships, and contextual variables that are hard to capture using only manual analysis Mourtzis et al. (2023). This gap is filled by predictive analytics which incorporates statistical modeling, ensemble learning and neural network-based prediction to produce credible forecasts of key performance indicators including attendance volume, dwell time, budget utilization, and revenue generation. There are various strategic benefits to implementing predictive modeling into the pipeline of managing the exhibition. Firstly, precise visitor forecasting enables organizers to adjust the strategies of staffing, security and crowd management and minimize operational risks and provide the visitor with a smooth experience Oufqir et al. (2020). Figure 1illustrates combined predictive modules which analyze the visitor trends and exhibition performance. Second, the future dwell time and engagement are predictable and thus facilitate the optimization of spatial layouts, thus curators can create pathways, signage systems, and interactive areas that improve the flow and satisfaction of visitors.
Figure 1
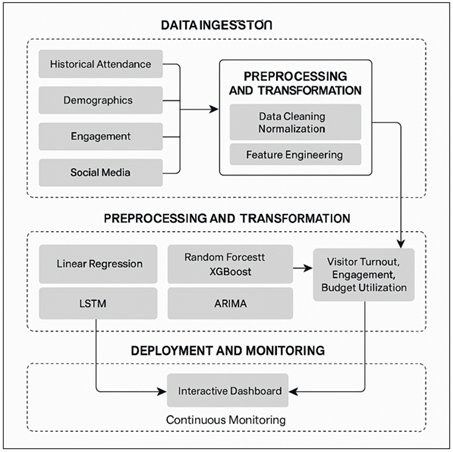
Figure 1 Operational Framework for Forecasting Key Success
Indicators in Photo Exhibitions
Third, revenue and cost projections enable the decision-makers to spend and save budgets wisely, to plan marketing activities and to assess the amount of the return on investment more accurately. These features are especially important in large or ongoing exhibitions when minor inefficiencies may translate into huge financial, and experience losses. Predictive analytics also enable one to engage in a personalized and targeted communication with prospective audience.
2. Related Work
Studies on predictive analytics in cultural and creative industries have begun to develop considerably over the recent ten years, owing to the increased digitization of audience behavior and access to a variety of sources of data. Initial research on the topic of exhibition planning was mostly descriptive, and retrospective analysis, and explored the question of attendance patterns, demographic segmentation, and visitor satisfaction, by survey and manual observation. Although these attempts were useful as they offered background knowledge, they were not able to forecast the future trends and to make the best choices in a changing environment Rajpurohit et al. (2023), Wu (2022). The later studies brought in statistical time-series forecasting techniques like ARIMA, Holt-Winters exponential smoothing and forecasting by regression to predict museum attendance and event attendance. These models were moderately successful within contexts that showed consistent visitation, but were not successful with nonlinear or seasonal variability or socially induced variability. In cultural event management, the similar studies used regression framework-based models to correlate marketing efforts, demographics, and ticket purchases, but those methods failed to scale with large dimensional data or complicated audience patterns Shi et al. (2019). Ensuring dependence on heterogeneous features, a nonlinear relationship, and missing values, ensemble models including Random Forest, Gradient Boosting, and XGBoost have become popular in cultural analytics with the advent of machine learning. The results of research on these models in the context of predicting the number of visitors in a museum, managing a heritage site, and predicting attendance in the performing arts demonstrated that the models are more accurate and robust Chang (2021). Table 1 presents important research comparing predictive models and cultural planning strategies. The combination of social media data sentiment ratings, levels of engagement, hashtags, and interactions around the event contributed to the further improvement of predictive performance in order to capture digital indicators that pre-empt physical visitation.
Table 1
|
Table 1 Summary in Predictive Analytics for Cultural and Exhibition Planning |
||||
|
Domain Focus |
Data Sources Used |
Methods Applied |
Major Findings |
Limitations Identified |
|
Museum attendance
forecasting |
Historical footfall |
ARIMA, Regression |
Strong trend prediction |
Poor handling of
nonlinearities |
|
Art event turnout Barath et al. (2023) |
Ticketing, social media |
Random Forest |
Social engagement improves
accuracy |
Limited demographic modeling |
|
Exhibition visitor flow |
Indoor sensors |
LSTM |
Effective temporal modeling |
Requires high-quality sensor
data |
|
Cultural festival analytics |
Social media sentiment |
XGBoost |
Strong predictive power |
Sparse off-season data |
|
Gallery engagement |
Eye-tracking, heatmaps |
CNN + RF |
High spatial prediction |
Hardware-dependent |
|
Theatre audience forecasting
Li (2024) |
Surveys, ticketing |
Regression models |
Good for stable patterns |
Low adaptability to sudden
shifts |
|
Heritage site turnout Qilin et al. (2025) |
Tourism and climate data |
Gradient Boosting |
Weather strongly influences
turnout |
Regional variations ignored |
|
Art event marketing impact |
Online engagement |
LSTM |
Captures trend shifts well |
Needs frequent retraining |
|
Museum retail forecasting |
POS and visitor data |
XGBoost |
Accurate retail predictions |
Limited cross-season
generalization |
|
Cultural experience
modelling Karimi (2023) |
Demographics, sensors |
Hybrid ML |
Effective multimodal fusion |
High model complexity |
|
Exhibition budget planning |
Financial logs |
Linear + GBM |
Reliable short-term
estimates |
Struggles with dynamic
pricing |
|
Social media–driven turnout |
Instagram, Twitter |
LSTM, RF |
Buzz strongly predicts
turnout |
Sentiment ambiguity issues |
3. Dataset Collection and Preprocessing
3.1. Sources: historical attendance, demographics, engagement, social media, ticketing
The heterogeneous data sources, as a combination of which the audience behavior, event dynamics, and contextual influences are captured, must be thoroughly integrated to become a dataset used in predictive analytics of photo exhibition planning. Historical attendance records give the underlying time variations that are required to comprehend seasonality, weekday and weekend variations, event spikes, long-term trends Xing and Guo (2022). Adding to this, demographic data, including age brackets, gender balance, work experience, location and previous attendance records, permits audience segmentation and targeting of personalized outreachs and prediction of behavioral trends. Onsite interaction related metrics such as dwell time, path sequences, heatmap distributions, sensor-based movement patterns provide a further insight into the way visitors experience the exhibition space. Social media data are becoming a significantly more important part, which captures real-time sentiment, pre-event buzz, hashtag frequency, and influencer activity, as well as content-sharing rates, which are strongly correlated with footfall and engagement Mohamed and van der Laag Yamu (2024). The ticketing information completes the collection pipe by adding transactional pointers such as booking time, type of ticket, pricing level, cancellation patterns and group purchases.
3.2. Data Cleaning, Normalization, and Missing Value Handling
Since there are multiple input sources, data preprocessing is essential in terms of consistency, reliability and analytical validity. The cleaning procedure starts with the identification and remedy of duplicate records, the inappropriateness of inconsistent time stamps, and standardization of demographic labels and categorical characteristics. To ensure the stability of the model, noise mitigation methods, like averaging sudden outliers in the attendance logs or removing the outliers in the dwell-time values, can be used. It is a usual occurrence in demographic surveys, social media metadata, and ticketing logs that do not have the values; therefore, suitable imputation techniques should be used Zeng et al. (2024). Numerical variables can be imputed with the help of mean, median, k-nearest neighbor imputation or regression-based imputation and categorical gaps can be replaced with mode imputation or probabilistic distributions. It might be required to impute or remove features that are feature-specific in high sparsity cases. Normalization is used to make sure that the variables of varying scales (e.g., ticket price, sentiment scores, visitor age) added to the model each contribute proportionally when it is being trained. Some of the techniques used to stabilize the gradient based algorithms and clustering are min -max scaling, z-score standardization, and robust scaling against interquartile range Strachan-Regan and Baumann (2024).
3.3. Feature Engineering and Variable Selection
The feature engineering technology converts heterogeneous data in its unstructured form into structured predictors that reflect valuable behavioral and temporal trends. Historical attendance shows that some useful features are moving averages, seasonality indicators, lag variables and holiday/event flags. Demographic information may be coded into segmented population groupings, diversity indices, and propensity scores of previous visitors. The spatial and experiential features that are generated by engagement metrics include average dwell time, high interaction areas, visit trails, and number of interactions per session. Figure 2 presents categorized features of time, sentiment and audience that are predictive of modeling. Social media offers sentiment polarity, trending keyword frequency, user engagement velocity, influencer amplification scores, and time buzz curve, which usually predict turnout.
Figure 2
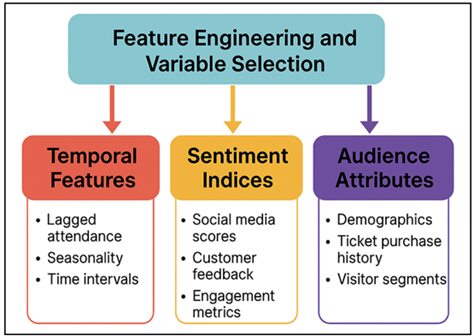
Figure 2 Categorization of Temporal, Sentiment, and Audience
Features for Predictive Modeling
Some revenue-related characteristics are added to ticketing variables such as booking lead time, dynamic pricing responsiveness, peak purchase windows, and the likelihood of cancellations. The variable selection is used to make sure that only the most meaningful and non-redundant features get into the predictive pipeline.
4. Predictive Modeling Framework
4.1. Architecture of the proposed predictive pipeline
The proposed predictive pipeline in planning photo exhibitions is an architecture that is formed as a modular, scalable, and data-driven framework to combine the heterogeneous inputs into structured analytical forms and generate actionable predictions to the primary success indicators in an exhibition. The architecture is comprised of four interconnecting layers, and the proposed architecture includes data ingestion, preprocessing and transformation, model training and forecasting, and deployment with continuous monitoring. The ingestion layer of data receives multimodal data based on past attendance records, demographic records, engagement sensors, social media APIs, and ticketing records. All these inputs are directed to a central data warehouse or cloud-based data storage environment with high source availability and synchronization. Preshop processing layer does the cleaning work, normalization, time alignment and feature engineering to produce cleaner variables including lagged attendance variables, sentiment indexes, dwell-time aggregates and ticket-purchase profiles. It has several predictive engines on the modeling layer such as Linear Regression, random forest, XGBoost, LSTM networks and ARIMA organized in a comparative or ensemble format. Hyperparameter tuning modules are modules that optimize each model by applying methods such as grid search, Bayesian optimization or cross-validation. The most efficient models will then produce predictions relating to visitor attendance, the amount of engagement, budget expenditure and revenue figures.
4.2. Model types considered
1) Linear
Regression
Linear Regression is the standard model in predicting indicators related to the exhibition because it is simple to use, interpret, and efficient. It presupposes the linear correlation between the variables of predictors, including demographics, sentiment scores, booking trends, and target variables, including turnout or revenue. Although it is not very powerful to capture nonlinear behaviours, it gives a clear picture on the presence of variables and directional patterns. The model can be used in the case of early stage exploratory analysis and scenario simulation in a stable environment. Nevertheless, when dealing with cultural events where audience trends tend to change because of social pressure, seasonality, and changing preferences, Linear Regression might fail to capture the complicated trends. Nonetheless, it has high transparency, and it is computationally inexpensive, which makes it an important benchmark in the predictive modeling pipeline.
2) Random
Forest (RF)
Random Forest is an effective ensemble model that can effectively work with heterogeneous, noisy, and nonlinear data, which are characteristic of the field of exhibition planning. RF enhances robustness, variance, and overfitting by combining the prediction of bootstrapped samples of several decision trees trained on different bootstrapped samples. It is the best at modeling complicated interactions of demographics, social media use, time-based variables, and ticketing behavior. Furthermore, RF delivers ranking of feature importance, which allows curators and planners to determine some crucial predictors of turnout or engagement.
3) XGBoost
XGBoost (Extreme Gradient Boosting) is a state of art ensemble technique, which constructs sequential decision trees with gradient boosting with regularization that regulates overfitting. This is because of its capability to develop complex nonlinear relationships and interactions, thus making it one of the most precise ways of predicting attendance, dwell time, and revenue. XGBoost provides its own mechanisms to deal with missing data, is capable of processing large-dimensional data with great efficiency and is fast, because the operations are parallel. Fine-grained model tuning is also made possible by its optimization strategies, which include shrinkage, subsampling and learning-rate control. XGBoost is useful in planning photo exhibitions in the conditions of data that are characterized by the unpredictable interaction of temporal, behavioral, and social indicators.
4) LSTM
(Long Short-Term Memory)
The LSTM networks are a type of deep learning that is particularly suitable to capture long-range temporal relationships, hence it is the best to predict time-dependent patterns in exhibition attendance, engagement patterns, or social media trends. The LSTMs in contrast with the traditional RNNs have memory gates, which control information flow, which allows them to learn cyclic trends, seasonal changes, and trend shifts without the vanishing-gradient problems. They are best in situations where forecasting is based on sequential data like number of people coming every day, a purchase of a ticket over time or dynamically generated online opinion.
5. Forecasting Key Exhibition Success Indicators
5.1. Visitor turnout prediction
One of the key elements of the exhibition planning framework is visitor turnout prediction since proper predictions allow optimizing staffing, managing crowds, making marketing choices, and space distribution. The prediction process starts with the incorporation of historical attendance records with dynamic variables like social media activity, buying behavior, demographic groups, season cycles and other externalities like festivities, holidays or rival cultural events. Machine learning algorithms (especially XGBoost and Random Forest) are able to model nonlinear interactions between these predictors, whereas LSTM are able to model temporal networks and changing behavioral patterns. These models extract attendance lag, event spikes, influencer buzz, and booking lead times to provide accurate predictions of the daily or weekly attendance. The projection of outputs can also include scenario-based simulations that enable the planners to model what will happen to the projected footfall when the marketing is intensified, ticket prices are adjusted or the themes are changed. Also, the predictive solution based on segmentation allows tailored strategies, such as expecting the increased turnout of younger demographics in special digital or thematic exhibitions. Village turnout forecasting allows one to make sure that there is no under- or over-preparedness, and an efficient resource allocation plan is created.
5.2. Engagement and Dwell Time Forecasting
The engagement and dwell time forecasting is important in estimating how visitors perceive and respond to the photographic content by interacting, moving around the gallery spaces, and reacting to the thematic aspects. Predictive models, based upon sensor-recorded movement data, heatmaps, interaction history, and previous patterns of behavior, inform decisions related to understanding the duration of stay in particular areas, which exhibits generate the greatest attention, and the engagement of demographic segments and exhibitions. The LSTM and the Random Forest models are among the most effective models to use in this task, since both of them capture both sequential interaction and non-linear engagement dynamics depending on the exhibit layout and visitor flow. Social media indicators, such as sentiment polarity, comment depth, frequency of visual-posts, and others can be used as external predictors of the engagement depth, and can be used to estimate the immersiveness or emotional resonance the visitors will experience when visiting the exhibition.
Figure 3
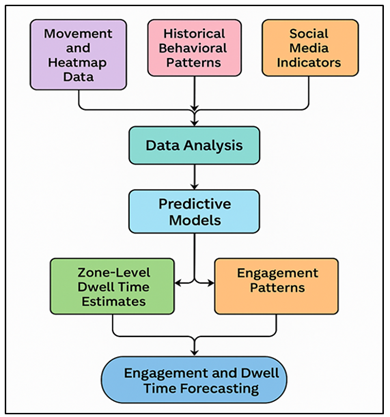
Figure 3 Predictive Flowchart for Behavioral
Engagement and Dwell Time Estimation
Together with ticketing data, e.g., the length of a session or an attendance of a guided tour, the forecasting system produces the finer engagement metrics, and, in turn, planners can then optimize the spatial design, lighting plans, pathways, and digital augmentation locations. Predictive workflow estimates behavioral engagement and audience dwell time as indicated in Figure 3.
6. Results and Discussion
The predictive modeling model showed a good level of forecasting on turnout, engagement, and revenue factors. XGBoost and Random Forest models always performed better than the baseline models, which captured nonlinear behaviors of the audience and intricate interactions between the variables. Actions of sequential patterns enhanced better results of LSTM models, particularly in forecasting fluctuations of daily attendance and fluctuations of dwell-time that are stimulated by real-time social media activity. ARIMA gave less adaptive and stable estimates of the future, which supports its status as a comparative baseline.
Table 2
|
Table 2 Model Performance Comparison for Visitor Turnout Forecasting |
|||||
|
Metric / Model |
Linear Regression |
Random Forest |
XGBoost |
LSTM |
ARIMA |
|
RMSE (Visitors) |
184.7 |
126.4 |
112.8 |
105.3 |
158.6 |
|
MAE (Visitors) |
139.2 |
94.1 |
81.7 |
76.4 |
121.5 |
|
MAPE (%) |
18.6 |
11.3 |
9.8 |
8.7 |
15.4 |
|
Forecast Bias (%) |
7.4 |
4.1 |
2.6 |
2.2 |
5.8 |
Table 2 gives a clear numerical comparison of five predictive models Linear Regression, Random Forest, XGBoost, LSTM, and ARIMA used in visitor turnout forecast. The differences in the performance can be observed in all of the metrics.
Figure 4
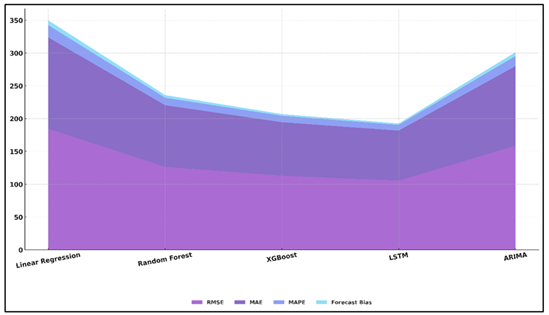
Figure 4 Composite Error Profile: RMSE, MAE, MAPE, and Bias
Comparison
The comparative error metrics presented in Figure 4 demonstrate the differences in model accuracy and model bias. Linear Regression performs the worst with RMSE of 184.7 visitors and MAE of 139.2 which indicates that it has low capability of modeling nonlinear turnout changes. ARIMA does slightly better with the RMSE of 158.6 and MAE of 121.5, but still, it has a significant forecast bias of 5.8. The RMSE distribution in Figure 5 indicates that there is a variation in performance between ML models.
Figure 5
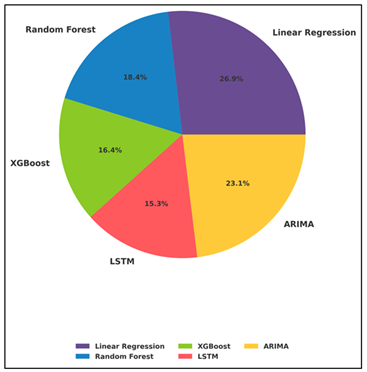
Figure 5 Proportion of Prediction Error (RMSE) Across ML
Models
Random Forest gives an enhanced prediction performance, as it has an RMSE of 126.4, MAE of 94.1, and MAPE of 11.3 which is high to reflect on complex pattern of behavior. XGBoost goes a step further with an RMSE of 112.8, MAE of 81.7, and a reduced forecast bias of 2.6% and proves to be an effective gradient-boosted learning.
Table 3
|
Table 3 Engagement, Dwell-Time, and Revenue Forecasting Accuracy |
|||||
|
Indicator / Model |
RF |
XGBoost |
LSTM |
ARIMA |
Linear Regression |
|
Dwell Time RMSE (min) |
4.9 |
4.1 |
3.6 |
6.8 |
7.3 |
|
Engagement Prediction
Accuracy (%) |
87.4 |
91.2 |
93.5 |
79.6 |
82.1 |
|
Spatial Flow Error Rate (%) |
12.6 |
9.8 |
8.3 |
15.7 |
18.4 |
|
Revenue Forecast MAPE (%) |
11.8 |
9.1 |
10.4 |
14.9 |
17.3 |
Table 3 provides a quantitative comparison of the model performance on dwell-time forecasting, engagement prediction, spatial flow estimation, as well as revenue forecasting. It is evident that LSTM will provide the highest total accuracy, lowest dwell-time RMSE of 3.6 minutes, the highest engagement accuracy of 93.5, and the error of the spatial flow of 8.3. The comparative performance benchmarking is presented in Figure 6; it represents RF, XGBoost, LSTM, ARIMA, and Linear Regression. These values show its better performance in the ability to model sequential behavior patterns in the exhibition environment.
Figure 6
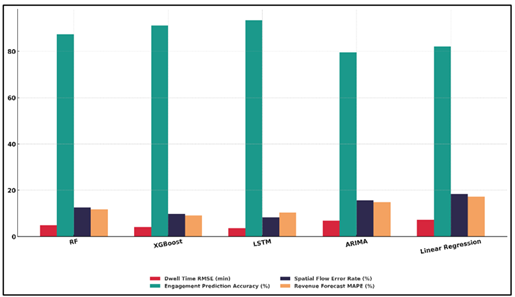
Figure 6 Performance Benchmarking of RF, XGBoost, LSTM, ARIMA, and Linear Regression Models
XGBoost is also doing a similar job with dwell-time RMSE of 4.1, engagement accuracy of 91.2, and a spatial flow error rate of 9.8 and the highest accuracy of revenue forecasting with a MAPE of 9.1. This underscores the ability of XGBoost to be good at nonlinear relationships between demographic, spatial, and social variables.
7. Conclusion
This research paper evidences the disruptive nature of predictive analytics as a tool in reinventing the approach of planning, controlling, and reviewing photo exhibitions. The study combines heterogeneous data sources, such as historical attendance, demographic trends, engagement measures, social dynamics, and ticket purchases, in one analytical pipeline, which potentially points to the effectiveness of data-driven approaches in enhancing strategic and operational decision-making to a greater extent. The predictive models discussed within the framework provide helpful information about visitor attendance patterns, spatial interaction patterns, and monetary results, enabling organizers to foresee issues, better resource allocation, and create yet more fulfilling visitor experience patterns. According to the results, the methods of ensemble learning, including XGBoost and Random Forest, are always effective to use in comparison with the conventional statistical models, particularly in the situation of nonlinear visitor trends and other contextual factors. LSTM networks can also be highly effective in predictions over time and thus are also appropriate where exhibitions are to be predicted based on the trends of digital engagement or changes in the interests of the audience. These results confirm the significance of improved machine learning methods in cultural analytics, especially the situations when the dynamic behavior and external factors influence visitor reactions. In spite of such developments, issues of data sparsity, cultural diversity, and fast changing preferences of the audience are still a challenge.
CONFLICT OF INTERESTS
None.
ACKNOWLEDGMENTS
None.
REFERENCES
Barath, C.-V., Logeswaran, S., Nelson, A., Devaprasanth, M., and Radhika, P. (2023). AI in Art Restoration: A Comprehensive Review of Techniques, Case Studies,
Challenges, and Future Directions. International Research
Journal of Modern Engineering Technology and Science,
5, 16–21.
Chang, L. (2021). Review and Prospect of Temperature and Humidity Monitoring for Cultural Property Conservation Environments. Journal of Cultural Heritage Conservation, 55, 47–55.
Karimi, K. (2023). The Configurational Structures of Social Spaces: Space Syntax and Urban Morphology in the Context of Analytical, Evidence-Based Design. Land, 12, 2084. https://doi.org/10.3390/land12112084
Li, P. (2024). Cultural Communication in Museums: A Perspective of the Visitors’ Experience. PLOS ONE, 19, e0303026. https://doi.org/10.1371/journal.pone.0303026
Lu, F., Zhou, H., Guo, L., Chen, J., and Pei, L. (2021). An ARCore-Based Augmented Reality Campus Navigation System. Applied Sciences, 11, 7515. https://doi.org/10.3390/app11167515
Mohamed, A. A., and van der Laag Yamu, C. (2024). Space Syntax has Come of Age: A Bibliometric Review from 1976 to 2023. Journal of Planning Literature, 39, 203–217. https://doi.org/10.1177/08854122231208018
Mourtzis, D., Angelopoulos, J., and Panopoulos, N. (2023). Unmanned Aerial Vehicle (UAV) Path Planning and Control Assisted by Augmented Reality (AR): The Case of Indoor Drones. International Journal of Production Research, 62, 3361–3382. https://doi.org/10.1080/00207543.2023.2232470
Oufqir, Z., Abderrahmani, A. E., and Satori, K. (2020). ARKit and ARCore in Service to Augmented Reality. In Proceedings of the 2020 International Conference on Intelligent Systems and Computer Vision (ISCV) (Fez, Morocco, June 9–11, 2020). https://doi.org/10.1109/ISCV49265.2020.9204243
Qilin, Z., Zhang, L., Li, H., and Estrada, M. V. (2025). Digital Transformation of the Shaolin Cultural Industry: Pathways and Challenges for Achieving Sustainable Development [Preprint]. Preprints. https://doi.org/10.20944/preprints202501.0407.v1
Rajpurohit, A. M., Kumar, P., Singh, D., and Kumar, R. R. (2023). A Review on Visual Positioning
System. In Proceedings of the Kilby
100: 7th International Joint Conference
on Computing Sciences (Phagwara,
India, May 5, 2023).
Shi, K., Su, C., and Lu, Y.-B. (2019). Artificial Intelligence (AI): A Necessary Tool for the Future Development of Museums. Science and Technology of Museums, 23, 29–41.
Strachan-Regan, K., and Baumann, O. (2024). The Impact of Room Shape on Affective States, Heart Rate, and Creative Output. Heliyon, 10, e28340. https://doi.org/10.1016/j.heliyon.2024.e28340
Wu, S.-C. (2022). A Case Study of the Application of 5G Technology in Museum Artifact Tours: Experimental Services using AI and AR Smart Glasses. Museum Quarterly, 36, 111–127.
Xing, Z., and Guo, W. (2022). A New Urban Space Analysis Method Based on Space Syntax and Geographic Information System using Multisource Data. ISPRS International Journal of Geo-Information, 11, 297. https://doi.org/10.3390/ijgi11050297
Zeng, Z., Zhang, K., and Zhang, B. (2024). Study on the Influence of Spatial Attributes on Passengers’ path Selection at Fengtai High-Speed Railway Station Based on Eye Tracking. Buildings, 14, 3012. https://doi.org/10.3390/buildings14093012
|
|
 This work is licensed under a: Creative Commons Attribution 4.0 International License
© ShodhKosh 2025. All Rights Reserved.