ShodhKosh: Journal of Visual and Performing ArtsISSN (Online): 2582-7472
|
|
Data Analytics for Audience Preferences in Photography
Saurabh Kumar 1![]() , Yuvraj Parmar 2, Smitha
K. 3
, Yuvraj Parmar 2, Smitha
K. 3![]() , Shriya Mahajan 4
, Shriya Mahajan 4![]()
![]() ,
Anushree Gaur 5
,
Anushree Gaur 5![]()
![]() ,
Dr. Anita Walia 6
,
Dr. Anita Walia 6![]()
![]() ,
Shrikant Shrimant Barkade 7
,
Shrikant Shrimant Barkade 7![]()
1 Assistant,
Professor, School of Sciences, Noida International University, India
2 Research
and Development, Chitkara University, Himachal Pradesh, Solan 174103, India
3 Lloyd Law College, Greater Noida, Uttar Pradesh 201306, India
4 Centre
of Research Impact and Outcome, Chitkara University, Rajpura- 140417, Punjab,
India
5 Assistant
Professor, Department of Development Studies, Vivekananda Global University,
Jaipur, India
6 Associate
Professor, Department of Management Studies, JAIN (Deemed-to-be University),
Bengaluru, Karnataka, India
7 Department
of Chemical Engineering, Vishwakarma Institute of Technology, Pune,
Maharashtra, India
|
|
|
ABSTRACT |
|
|
Photography as
a visual art form and effective medium of communication has experienced a
major revolution in the digital era. As the social media platforms and visual
content consumption have expanded rapidly, the need to comprehend the
preferences of the audience has become the major matter of focus among
photographers, brands, and creators of visual content. In this paper, the
authors discuss the application of data analytics to analyse, interpret and
forecast the audience behavior in the context of photographic content. The
study combines the methods of quantitative, qualitative, and mixed methods to
be based upon the existing literature that deals with the topics of engaging
with visual media and making a creative decision based on the numbers. The
social media analytics, surveys, and level of engagement are integrated in
data collection, and to extract full insights, the analytical tools, Python,
R, and Tableau are used. Analysis explores descriptive patterns of
engagement, demographic and psychographic patterns of audience, and
correlation of photographic styles and reactions of the viewer. Also,
predictive modeling is employed to determine the arising preferences and
future aesthetic trends in digital photography consumption. The results
indicate the increased value of customized visual content, optimization
techniques of gaining the interest of social media users, and the use of
predictive analytics to forecast market changes. |
|||
|
Received 22 February 2025 Accepted 21 June 2025 Published 20 December 2025 Corresponding Author Saurabh Kumar, saurabh.kumar@niu.edu.in DOI 10.29121/shodhkosh.v6.i3s.2025.6800 Funding: This research
received no specific grant from any funding agency in the public, commercial,
or not-for-profit sectors. Copyright: © 2025 The
Author(s). This work is licensed under a Creative Commons
Attribution 4.0 International License. With the
license CC-BY, authors retain the copyright, allowing anyone to download,
reuse, re-print, modify, distribute, and/or copy their contribution. The work
must be properly attributed to its author.
|
|||
|
Keywords: Audience Preferences, Data Analytics, Photography
Engagement, Predictive Modeling, Visual Media Consumption |
|||


1. INTRODUCTION
1.1. Background of photography as a visual art and communication medium
Photography has long been considered as one of the most significant forms of visual art which can appeal to the moments, feelings and stories in a way that will not be limited by the language or culture. Since the dawn of time of the discovery of the camera obscura and the invention of chemical processes, photography has been constantly changing, and it has influenced the way in which people understand the world they are living in. Being a form of art, it offers artists a chance to create with composition, light, perspective, and visual narrative to express thoughts and feelings. Also, photography is a great communication tool in that people, communities, and organizations can exchange information, record the events, and communicate identity Burton and Toh (2023). Due to the developments in digital technology, photography is more available than ever before. The online platforms, editing software and smartphones have made the production and dissemination of photographic content democratic. As a result, consumers are exposed to thousands of images per day in social media, advertisement, journalism and entertainment. This overload explains the role of photography in forming the opinion of people, behavior change and passing messages fast and efficiently Saah et al. (2023). With the rise of visual communication, it is necessary to comprehend the way photography appeals to a wide range of audiences to allow creators to maximize the effect and clarity.
1.2. Importance of Understanding Audience Preferences
Comprehending audience preferences has turned out to be important to photographers, digital creators as well as visual communicators in a media landscape that has been characterized by the fast pace of content and the high competition of the media attention. With people receiving visuals through the social media feeds, adverts, and other online platforms, their preferences determine what they watch, interact with and even share. In the case of the photographer, it is possible to define these preferences to better match the output of creativity and the expectations of the audience Hawkins (2022). This knowledge does not only improve the power to create strong images but also provides information on the style, themes, color schemes, and subject.
Figure 1
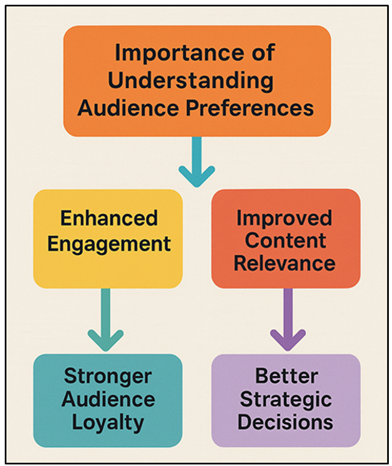
Figure 1 Structural Representation of Audience Preference Understanding
In addition, understanding of how people will respond to the information helps in enhancing better communication. Figure 1 shows structural elements applied to make and interpret audiences preferences. By knowing what will appeal to their target demographic in an emotional or aesthetic way, photographers can create images that will create a stronger bond and convey a message more clearly. It is especially relevant to commercial photography, branding activities, and social media influencers who need to be visible and successful through the audience engagement Donig et al. (2023). In addition to artistic and commercial advantages, the knowledge of the audience preferences also helps planning any strategy that enables creators to adjust to changing trends and cultural shifts.
1.3. Role of Data Analytics in Modern Photography
The impact of data analytics on contemporary state of photography is growing more and more important, as it alters the creation of visual content and distribution and selection of it. Thanks to the amount of information generated by the social media platforms, websites, and online galleries, photographers are now able to observe the detail of the interaction between the viewers, their behavioral patterns, as well as demographics Xu (2022). Such information allows creators to see what kind of images gain more views, likes, shares, or comments and change their style and thus their thematic orientation. Photographers are able to do descriptive, diagnostic, and predictive analysis using analytical tools like Python, R, Tableau, and embedded metrics of the platform Philippopoulos et al. (2024). These insights will determine the trends like the popularity of certain color hues, compositions, genres, or posting times. Predictive modeling also helps creators to gauge the upcoming trends and modify their work to suit the expectations of the future audience. In the case of commercial photographers and brands, data analytics enables a tailored visual campaign as it matches the image with the consumer interests and demands in the market Schellnack-Kelly and Modiba (2024).
2. Literature Review
2.1. Previous studies on audience behavior in visual media
Audience behavior studies in visual media have developed considerably with the development of the digital platform and provide good information about how people interpret, engage with, and react to visual content. Initial research in media psychology has focused on using visual stimuli in perception, emotional reaction, and cognition Rosen (2024). Through these early publications, the authors were able to emphasize the effect of color, composition, and storytelling on the viewer attention and retention. With the development of the visual media, researchers started examining the psychological reasons behind the choice of content and reasons behind entertainment, identity formation, and social belonging. The study changed its focus with the emergence of the internet and social networking sites to the study of the behavior of interactive audiences Wen and Ma (2024). Researchers investigated the way to make user preferences according to the culture, individual interests and exposure to the digital community. A similar study of how visual aesthetics correlate with engagement metrics was also conducted, showing that there are some trends in perception regarding how audiences like, share or comment on images. These papers indicated that the actions of the audience can be influenced by the artistic properties, as well as the contextual features of the platform algorithms, and social pressure Derda (2024). The modern studies combine the behavioral analytics with big data to investigate the audience trends at the scale. Heatmaps, eye-tracking, and datasets based on engagement are used by scholars to measure reactions to a particular visual aspect.
2.2. Use of Data Analytics in Creative Industries
Data analytics is now an inseparable part of creative industries that allow practitioners to balance creative innovation with strategic and audience-focused decision-making. In the past, the levels of creativity like photography, film, advertising, and design used intuition and the old-fashioned market research to capture the preferences of the consumers. Nevertheless, the digitization of the creative industries has resulted in the creation of enormous data sets of audience behaviour, purchasing patterns, and engagement rates Nuccio and Bertacchini (2022). This has promoted the use of analytics tools to promote creative planning and content development. Data analytics are used in advertising and branding to choose target demographics, forecast consumer behavior and measure the success of campaigns. Data-driven insights are used to create optimal color schemes, message style, and aesthetics by creative teams according to what appeals the most to audiences Perry et al. (2024). Likewise, in cinema and entertainment, analytics are applied to understand the viewership trends, suggest the personalized content, and optimize the production strategies. Social media has also increased the power of analytics, which provides immediate feedback on the response of the audience Ncube et al. (2024).
2.3. Emerging Trends in Photography Consumption
Consequently, photos with a palpable visual appeal, minimalistic, and emotional resonance tend to be more actively involved. The other trend that is important is the growing significance of personalization. Audiences are no longer satisfied with content that in any way does not fit their aesthetic preferences, interests, or cultural contexts Ferrato et al. (2022). Algorithms recommend increasingly personalized photo feeds, which strengthen niche visual tastes and affect the popularity of the styles. The result of this personalization is the emergence of micro-aesthetics, consisting of soft minimalism, film-cinema tones, and vintage filters. Photography consumption is also affected by the introduction of artificial intelligence Johnston (2020). Table 1 presents the previous literature where data analytics was used to evaluate the preferences of the audience. Artificial intelligence-driven products suggest images, create visuals, and evaluate aesthetic features, which form the user expectations of creativity and quality.
Table 1
|
Table 1 Summary of Related Work on Data Analytics for Audience Preferences in Photography |
||||
|
Study Focus |
Methodology |
Data Source |
Tools Used |
Limitations |
|
Audience visual perception |
Experimental analysis |
Controlled image tests |
SPSS |
Small sample size |
|
Social media engagement |
Quantitative metrics |
Instagram data |
Python |
Limited to single platform |
|
Visual storytelling |
Qualitative interviews |
Photo series review |
NVivo |
Subjective responses |
|
Digital media behavior Muhtar et al. (2024) |
Mixed methods |
Online survey |
R |
Demographic skew |
|
Photography trends |
Trend mining |
Pinterest boards |
Tableau |
Platform bias |
|
Predictive engagement |
Machine learning |
Twitter images |
TensorFlow |
Limited aesthetic features |
|
Cultural influence on
visuals Wallace et al. (2023) |
Ethnographic study |
Community photography |
Manual coding |
Small cultural scope |
|
User emotional reactions |
Sentiment analysis |
Comment analysis |
Python NLP |
Sentiment misclassification |
|
Visual marketing |
Quantitative study |
Brand photo ads |
Excel, SPSS |
Business-focused |
|
Algorithmic ranking |
Platform behavior study |
Social media algorithms |
R, API data |
Black-box algorithm limits |
|
Editing styles |
Comparative study |
Edited vs. raw images |
Lightroom analysis |
Narrow style selection |
|
Influencer photography |
Behavioral analytics |
Multi-platform |
Tableau |
Influencer-centric |
|
Aesthetic prediction |
Deep learning |
Image datasets |
CNN Models |
Requires large datasets |
3. Research Methodology
3.1. Research design (quantitative, qualitative, or mixed)
The type of research design that will be used in the present study is a mixed-method research design, which will include both quantitative and qualitative research methodologies to give a wholesome information on the preferences of the audiences when it comes to photography. Mixed design is especially appropriate because the behavior of the audience can be characterized both by quantifiable engagement patterns and by subjective perceptions which are created through individual experiences, cultural background and cultural values. The quantitative section is concerned with the numerical information obtained via social media sources, analytics boards, and the measurement of engagement. It attempts to draw patterns, correlations, and predictive indicators of audience interaction with different photographic styles, themes, and compositions, through statistical means [9]. In addition to this, there is the qualitative aspect, which examines further the motives of viewer reactions.
3.2. Data Collection Methods (Social Media Analytics, Surveys, Engagement Metrics)
Well-constructed questionnaires are used to collect data on the aesthetic preferences, the emotional reactions, and the inspirations to interact with a particular genre of images. Surveys can have closed and open-ended questions, and these can be analyzed statistically and more narrative feedback can be received. This approach assists in confirming and setting trends to social media measures. The analysis of engagement statistics also becomes more generalized with the help of analytical programs and third-party software monitoring trends on platforms. These are the click-through rates, viewing time and viewer retention ratings. These measures will allow an understanding of behavior trends and general efficiency of visuals.
3.3. Tools and software used for analysis
1) Python
Python is one of the key tools in this study, as it is not limited and it contains many data analysis libraries. It enables manipulation of big data set collected on the social media or a survey. Data cleaning, statistical calculations and visualisation can be done with libraries such as Pandas, NumPy and Matplotlib. Besides, Python also prides itself of machine learning structures, including Scikit-learn and TensorFlow, which may be utilized to generate predictive models that would be able to discriminate emerging trends in audience preference. It is the tool of great use in the analysis of dynamic engagement metrics because it has the ability to perform automation, web scrape and integrate APIs. Python as an open-source tool with a wide community and capability to process various data sources is the type of tool needed to complete a complete photographic data analysis.
2) R
R will be used in the study due to its strong statistical and enhanced visualization of data capabilities. It is particularly needed to conduct deep statistical analysis, behavioral modeling of the audience and the interpretation of the data taken by surveys. Data processing and graphical representation become simplified with the help of the following packages as ggplot2, dplyr and tidyr. The benefit of R is that it can work on complex statistical procedures, like regression models, correlation analysis, clustering techniques of audience segmentation. It has interactive visualization graphs which are handy in the presentation of the results in a clear form where the patterns of photographic engagements are easily comprehended. The R special packages applied in social science research makes it an effective tool of accomplishing not only quantitative research but also exploratory knowledge in the conditions of visual media research.
3) Tableau
The usage of Tableau in the current research is based on the fact that the data visualization and dashboarding software is a powerful tool that allows converting a complex dataset into a clear, interactive visual model. It enables users to build dynamic charts, heat maps, and trend analyses that depict the habits of engagement among the audience as far as different types of photography are concerned. The drag-and-drop interface of tableau allows one to explore the relationships of the data without having to know a lot of programming languages. This software also allows integrating the data of social media analytics, surveys, and external databases and allows complete visual comparison. It can produce interactive dashboards which make it easy to present findings in a way that is easily understandable to both the technical and non-technical audiences.
4. Data Analysis and Findings
4.1. Descriptive statistics on audience engagement
Descriptive statistics will form a fundamental basis of knowing general trends in the involvement of the audience with the material in the photo. Engagement metrics based on social media platforms such as likes, comments, shares, impressions, and save rates in the present study were summarized to show some overall patterns in the way the images were engaged with among the audiences. Mean, median, mode and standard deviation measures were employed to describe how the engagement was distributed among different photo categories. Such statistics allow determining which kinds of images elicit most of the above-average responses and which are not paid much attention to by the audience. Frequency distributions emphasize commonness of particular interactions so as to indicate, as an example, that viewers are more likely to like a photo than comment on it. The use of histograms and bar charts can also be used to demonstrate variability of engagement in various visual themes, e.g. portraits, landscapes, street photography or conceptual imagery. Moreover, time-based comparisons can be made with the help of descriptive analytics, which can help to see the most active times and find the patterns concerning the posting schedules. Engagement-to-reach ratios were determined in order to determine content effectiveness, i.e., the number of times the viewers engaged per number of times the images were shown.
4.2. Analysis of Demographic and Psychographic Patterns
The demographic and psychographic analysis of the patterns gives a better understanding of the way various groups of audiences interact with photographic material. Demographic analysis has variables like age, gender, geographic location, education level and income. Results show that younger viewers are inclined toward aesthetic styles that are thrilling and fashionable, whereas older viewers are more likely to be interested in documentary, nature, and images of cultural significance. The preferences also depend on geography whereby urban viewers are more interactive to lifestyle and street photography whereas rural viewers are more interactive to landscape and environmental photography.
Figure 2

Figure 2 Framework for Demographic and Psychographic Audience
Analysis
Psychographic analysis goes beyond the demographic by targeting the interests, values, lifestyle preferences and personalities of the audience. Figure 2 represents a framework of the combination of the demographic and psychographic factors to analyze the audience. In this work, the responses to surveys and interest categories provided by the platform are used to map the users into the psychographic categories, like the ones of creative enthusiasts, trend followers, story-driven viewers, and emotionally motivated viewers. Segmentation behaviors are different: creative enthusiasts are inclined toward experimental and abstract images, and trend followers are highly reactive to the popular filters and styles as well as viral aesthetics.
4.3. Correlation Between Photo Styles and Audience Reactions
Correlation analysis will be used to establish the nature and direction of relationships between photographic styles and audience reactions. The color schemes, types of composition, type of subject, degree of editing, and pattern of stylistics are some of the key variables within this study that will be used to determine how they can be used to determine the level of engagement. The analysis also determines the visual attributes that correlate most with likes, comments and shares using statistical tools such as Pearson correlation coefficients, heatmaps and scatterplots. As an example, the high-color contrast photos tend to have a high positive correlation with likes, which may indicate that the representations that draw the attention of users the most are visually striking. Clean and minimalistic compositions are likely to be associated with increased rates of saves, which means that viewers like simplicity to be inspired or to refer to it. The portrait photography has a strong relationship with comments as the visitors tend to share emotional responses more towards human beings. On the other hand, highly edited pictures exhibit a moderate correlation, as some audiences are inclined to participate positively whereas others are willing to make use of natural beauty.
5. Applications of Data Analytics in Photography
5.1. Personalized content creation
The data analytics will help the photographers to develop custom content that is suited to the preferences and behavior of their specific target audiences. Through the study of demographic information, psychographic information, and engagement history, photographers will be able to determine the visual elements, subjects, and themes that can capture the interest of particular viewer segments most effectively. This enables makers to shed off the content strategy of generalization and reach out to a more personal approach. Creation of personalized content starts with the identification of patterns, including favorite color palettes or composition style or content that will always receive high engagement. These trends can be identified through the use of analytics tools that will include the way photographers can match their creative output with the expectation of the audience. Also, the segmentation methods allow creating tailored content to separate customer segments, including hobbyists, professionals, or niche interest groups. Content refinement is also achieved by feedback loops created by real-time engagement measurements. Through the feedback loop of user reaction, photographers can keep changing their style as they keep producing images based on user reaction to best capture the attention of viewers in a dynamic audience-centered creative process.
5.2. Optimizing Photography for Social Media Engagement
Data analytics is important to optimising the photo content to be used on social media to get the interactivity and engagement with the social media platform as it shows how the algorithm and user behaviors of a platform affect visibility and action. By analyzing the engagement metrics, i.e., likes, comments, shares, saves, watch time, the photographers will be able to notice which aspects of the content most effectively answer the audience. This encompasses the knowledge of best posting hours, the most favored color palettes, and styles of trends. Analytics tools also enable creators to compare the difference of performance across platforms. As an example, vertical content might be more successful on Instagram Reels or Tik Tok, and high-res horizontal images can be more successful on Pinterest. Through analysis of such patterns, photographers are able to make content specifically as each platform. The use of hashtags, keywords (trends), and audience retention also informs the adjustments to strategy, and assists the photographers to enhance their discoverability and reach.
6. Result and Discussion
6.1. Interpretation of analytical results
The outcomes of the analysis show that there are definite trends in the way audiences approach photographic material in that the visual style, the subject of the image, and emotional tone play a crucial role in shaping the viewer response. Descriptive statistics shows that pictures with bright colors and focus points are always viewed more. The findings of demographic and psychographic analysis indicate that various audience groups are inclined to be guided by various visual aesthetics, which represent different motivations and influences of a specific culture. The results of correlation support the idea that there is significant correlation between the style of composition and definite engagement behaviors.
Table 2
|
Table 2 Engagement Metrics by Photo Style (Sample Analytical Results) |
||||
|
Photo
Style |
Avg.
Likes |
Avg.
Comments |
Avg.
Shares |
Engagement
Rate (%) |
|
Portrait
Photography |
1,240 |
185 |
96 |
8.40% |
|
Landscape
Photography |
1,020 |
78 |
142 |
7.10% |
|
Street
Photography |
890 |
63 |
87 |
6.50% |
|
Minimalist
Photography |
1,380 |
54 |
65 |
9.10% |
|
Conceptual/Artistic |
760 |
110 |
49 |
5.80% |
Table 2 will allow looking at differences in the performance of various photographic styles of the engagement of the audience in terms of the most important indicators (likes, comments, shares and the overall engagement rate). The statistics show that Minimalist Photography is the most engaging with the rate of 9.10 and it is possible to suggest the audience reacting well to the clean compositions, simplicity, and aesthetics that can sooth their eyes. Figure 3 shows the trends of engagement-metrics in the different types of photography styles.
Figure 3
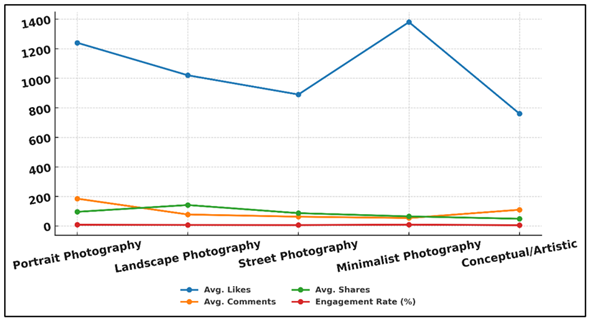
Figure 3 Trend Analysis of Engagement Metrics Across Photography Styles
On the same note, the High engagement on Portrait Photography in terms of its high average of 185 comments indicates emotional and personal attachment of viewers to human subjects. Figure 4 shows the graphic associations between engagement measures and various photo styles.
Figure 4
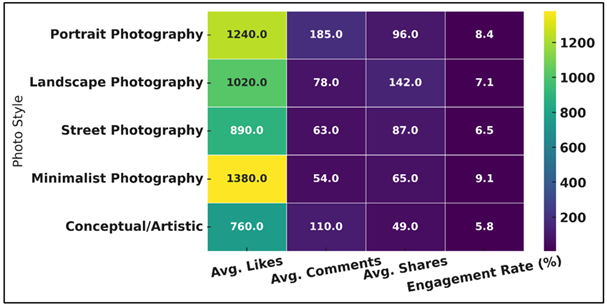
Figure 4 Visual Correlation of Engagement Metrics by Photo Style
Landscape Photography has the middle ranking in terms of likes and comments but has the greatest number of shares (142), meaning that images that appear beautiful or picturesque stand a higher chance of redistribution by the viewer. Street Photography presents even but comparatively less levels of engagement, which indicates that it is very engaging, but more specific. Figure 5 is a comparison of the mean likes, comments, shares and engagement among the different styles of photography. On the other hand, Conceptual/Artistic Photography is the least engaged at 5.80 that can be explained by the fact that the abstract character of the type of work is understood after more serious thinking, which means that less likely to get likes or shares.
Figure 5

Figure 5 Comparison of Average Likes, Comments, Shares, and Engagement Across Photography Styles
Nevertheless, its relatively large number of comments suggests that those who actually comment are more likely to be more thoughtful about it.
7. Conclusion
The research shows that data analytics becomes an even more important part of comprehending and determining audience preferences in the sphere of photography. Since visual content is dominating the digital communication sphere, photographers and content creators have an additional challenge of creating work that does not only contribute to their artistic identity but also makes a powerful impression on a varied and ever-changing audience. Combining the quantitative metrics of engagement with the demographic profiles, psychographic segmentation and predictive analysis, it becomes evident that through the tools of analysis, a researcher is able to discover meaningful trends in the behavior of viewers and this can be used to make more intelligent creative decisions. Data analysis indicates that some aspects of visuals, such as composition, color scheme, subject selection, and trendy tendencies directly affect the reaction of the audience on platforms. Besides, the non-constancy of preferences as opposed to demographic and psychographic variables confirms that preferences depend on the cultural context, lifestyles, and personal needs. With the shedding of these distinctions, photographers will be in a better position to come up with more centered and powerful material. The usefulness of foresight based on the use of data is also supported by the predictive results which illustrate how the emergence of a new trend in the aesthetics can be identified before it is completely produced in the market as a whole. The results of this research are rather related to content creation at the personal level.
CONFLICT OF INTERESTS
None.
ACKNOWLEDGMENTS
None.
REFERENCES
Burton, O., and Toh, D. J. (2023). Digital Dominance and Social Media Platforms: Are Competition Authorities Up to the Task? International Review of Intellectual Property and Competition Law, 54, 527–572. https://doi.org/10.1007/s40319-023-01302-1
Derda, I. (2024). Museum Exhibition Co-Creation in the Age of Data: Emerging Design Strategy for Enhanced Visitor Engagement. Convergence, 30, 1596–1609. https://doi.org/10.1177/13548565231174597
Donig, S., Eckl, M., Gassner, S., and Rehbein, M. (2023). Web Archive Analytics: Blind Spots and Silences in Distant Readings of the Archived Web. Digital Scholarship in the Humanities, 38, 1033–1048. https://doi.org/10.1093/llc/fqad014
Ferrato, A., Limongelli, C., Mezzini, M., and Sansonetti, G. (2022). Using Deep Learning for Collecting Data about Museum Visitor Behavior. Applied Sciences, 12(2), 533. https://doi.org/10.3390/app12020533
Hawkins, A. (2022). Archives, Linked Data and the Digital Humanities: Increasing Access to Digitised and Born-Digital Archives via the Semantic Web. Archival Science, 22(3), 319–344. https://doi.org/10.1007/s10502-021-09381-0
Johnston, A. (2020). Making the Invisible Visible Through Digital Technologies in Fieldwork. Future Anterior, 17, 31–44. https://doi.org/10.5749/futuante.17.2.0031
Muhtar, M., Tuhumury, J. J., and Rukoyah, R. (2024). Bibliometric Perspectives on Digital Technologies in Cultural Heritage: Analyzing Research Trends and Innovations. Eastasouth Journal of Social Science and Humanities, 2(1), 75–88. https://doi.org/10.58812/esssh.v2i01.350
Ncube, M. M., Ncube, and Ngulube, P. (2024). Systematic Review of Postgraduate Programmes Concerning Ethical Imperatives of Data Privacy in Sustainable Educational Data Analytics. Sustainability, 16(15), 6377. https://doi.org/10.3390/su16156377
Nuccio, M., and Bertacchini, E. (2022). Data-Driven Arts and Cultural Organizations: Opportunity or Chimera? European Planning Studies, 30, 1638–1655. https://doi.org/10.1080/09654313.2021.1916443
Perry, S., Foxton, K., Gargett, K., and Northall, L. (2024). Centring Audiences: What is the Value of Audience Mapping for Influencing Public Engagement with Cultural Heritage? Historical Environment: Policy and Practice, 15, 248–272. https://doi.org/10.1080/17567505.2024.2341361
Philippopoulos, P. I., Drivas, I. C., Tselikas, N. D., Koutrakis, K. N., Melidi, E., and Kouis, D. (2024). A Holistic Approach for Enhancing Museum Performance and Visitor Experience. Sensors, 24(3), 966. https://doi.org/10.3390/s24030966
Rosen, I. (2024). Advanced Visitor Profiling for Personalized Museum Experiences Using Telemetry-Driven Smart Badges. Electronics, 13(20), 3977. https://doi.org/10.3390/electronics13203977
Saah, R., Abban, S., and White, E. (2023). Use of Social Media in Public Archives: Perspectives about Ghana’s Readiness and Perceived Challenges. Journal of Contemporary Archival Studies, 10, Article 20.
Schellnack-Kelly, I., and Modiba, M. (2024). Developing Smart Archives in Society 5.0: Leveraging Artificial Intelligence for Managing Audiovisual Archives in Africa. Information Development, 41(3), 626–641. https://doi.org/10.1177/02666669241286224
Wallace, M., Poulopoulos, V., Antoniou, A., and López-Nores, M. (2023). An Overview of Big Data Analytics for Cultural Heritage. Big Data and Cognitive Computing, 7(1), 14. https://doi.org/10.3390/bdcc7010014
Wen, J., and Ma, B. (2024). Enhancing Museum Experience Through Deep Learning and Multimedia Technology. Heliyon, 10, e32706. https://doi.org/10.1016/j.heliyon.2024.e32706
Xu, D. (2022). An Analysis of Archive Digitization in the Context of Big Data. Mobile Information Systems, 2022, Article 1517824. https://doi.org/10.1155/2022/1517824
|
|
 This work is licensed under a: Creative Commons Attribution 4.0 International License
© ShodhKosh 2026. All Rights Reserved.