ShodhKosh: Journal of Visual and Performing ArtsISSN (Online): 2582-7472
|
|
Reinventing Curriculum through AI-Based Visual Feedback
Shilpi Sarna 1![]() , Rashmi Dahiya 2
, Rashmi Dahiya 2![]() , Dikshit Sharma 3
, Dikshit Sharma 3![]()
![]() , Anila Jayapaul 4
, Anila Jayapaul 4![]()
![]() , Romil Jain 5
, Romil Jain 5![]()
![]() , Kalpana Munjal 6
, Kalpana Munjal 6![]()
![]() ,
Gajanan Chavan 7
,
Gajanan Chavan 7![]()
1 Lloyd Law College, Greater Noida, Uttar Pradesh 201306, India
2 Assistant
Professor School of Sciences Noida International University 203201, Greater
Noida, Uttar Pradesh, India
3 Centre of Research Impact and
Outcome, Chitkara University, Rajpura- 140417, Punjab, India
4 Assistant Professor, Department of
Management Studies, JAIN (Deemed-to-be University), Bengaluru, Karnataka, India
5 Chitkara Centre for Research and
Development, Chitkara University, Himachal Pradesh,
Solan, 174103, India
6 Associate Professor, Department of
Design, Vivekananda Global University, Jaipur, India
7 Department of E and TC Engineering Vishwakarma Institute of
Technology, Pune, Maharashtra, 411037, India.
|
|
|
ABSTRACT |
|
|
The paper
introduces a unified system of AI-based visual feedback in order to redefine
the process of curriculum design with the help of information-driven
personalization and adaptive learning. The proposed system will integrate
Convolutional Neural Networks (CNNs) to extract visual features, Long
Short-Term Memory (LSTM) networks to model a temporal sequence, and the
Explainable AI (XAI) to be interpretable. The model is the integration of
multimodal learning data, including visual artifacts, behavioral logs, and
contextual records, in generating real-time visual feedback to enable
self-regulation of the learner and decision-making by the educator. The
experimental validation of two large scale datasets has shown an accuracy
score of 94, F1-score of 0.92 and Visualization Clarity Score (VCS) of 4.8,
proving that it is effective in both performance prediction and in
pedagogical transparency. Findings show that AI-based visual analytics would
improve engagement, metacognitive awareness, and curriculum flexibility and
would decrease the manual assessment work and increase the responsiveness of
instruction. Ethical and explainable design of the system creates trust and
accountability and it is appropriate to institutional deployment and to
integrate the policies. The paper comes to the conclusion that AI-based
visual feedback systems are a paradigm shift in the current educational
field, which unites cognitive science, artificial intelligence, and
educational governance in the direction of ongoing and learner-driven
evolution. |
|||
|
Received 08 February 2025 Accepted 13 June 2025 Published 20 December 2025 Corresponding Author Shilpi
Sarna, shilpi.sarna@lloydcollege.in
DOI 10.29121/shodhkosh.v6.i3s.2025.6759 Funding: This research
received no specific grant from any funding agency in the public, commercial,
or not-for-profit sectors. Copyright: © 2025 The
Author(s). This work is licensed under a Creative Commons
Attribution 4.0 International License. With the
license CC-BY, authors retain the copyright, allowing anyone to download,
reuse, re-print, modify, distribute, and/or copy their contribution. The work
must be properly attributed to its author.
|
|||
|
Keywords: Visual Feedback, Adaptive Curriculum, Learning
Analytics, Pedagogical Visualization, Curriculum Governance, Data-Driven
Education, Educational Technology |
|||


1. INTRODUCTION
The fast development of artificial intelligence has not only transformed the way of knowledge delivery process but has also transformed the way of perception, processing and improving the knowledge with the help of feedback process. The conventional models of curriculum have been based on standardized tests and fixed evaluation techniques that are incapable of capturing the dynamism of student learning Chen et al. (2020). On the contrary, AI-generated visual feedback comes with a paradigm shift the paradigm that enables learning systems to comprehend the patterns of cognition, display performance metrics instantly, and modify teaching material in response to changes. This new method combines information analysis, visual thinking, and teaching to develop individualized, reactive and emotionally involved learning settings. Visual feedback is driven by AI and it goes way beyond the static charts or grades Hwang et al. (2020). The educational systems are able to create visual representations of the learning behavior by processing multimodal inputs (not only student gestures and eye movements), but also sketch-based problem-solving patterns through deep learning architectures like Convolutional Neural Networks (CNNs) and transformer-based attention models Chassignol et al. (2018). These feedback systems allow instructors to recognize the conceptual bottlenecks, track the level of attention, and dynamically rearrange the course materials. To a learner, these systems convert such abstract development indications into a visual story, which makes them more self-understanding and motivated. The move to the reinvention of the curriculum with the help of AI-based visual analytics is in line with the educational reforms worldwide, which focus on learner-centric, competency-based methods of curriculum implementation. Combining real-time data visualization and machine learning creates a process of evidence-based curriculum design, in which, pedagogical choices are based on data being interpreted in real-time instead of retrospectively analyzed Chaudhri et al. (2013). In this respect, the teacher will replace a role of a knowledge disseminator with a cognitive designer, who will organize the use of AI tools to co-create meaningful learning experiences. The challenges that are also critical in this paradigm are the ability to guarantee the privacy of the data, control the transparency of algorithms, and be inclusive of the diverse learner populations. To handle such concerns, an interdisciplinary system comprising of AI ethics, human-computer interaction, and instructional design is needed Akgun and Greenhow (2022). The present paper, therefore, will propose a holistic framework of the visual feedback implementation based on AI in the context of the contemporary curriculum, its architectural structure, its algorithmic basis, and its instructional implications. This study aims to prove that intelligent feedback mechanisms can promote the adaptability of the curriculum, improve engagement and long-term retention of knowledge through the use of empirical assessment and visual analytics.
2. Conceptual Framework for AI-Based Visual Feedback
The AI-driven visual feedback conceptual framework redefines the educational ecosystem as the responsive, data-driven cycle that not only connects learners, educators, and intelligent systems but also makes them bound together. It theorizes learning as an ever-changing process, which is guided by machine intelligence that deciphers human cognitive and behavioral cues in terms of visual representation Ng et al. (2021), Zheng et al. (2021). The framework is based on four major dimensions, including data acquisition, AI analytics, visual feedback generation, and curriculum adjustment, to facilitate both micro-level (learner-specific) and macro-level (curriculum-wide) changes Escotet (2024). The initial layer known as Data Acquisition and Integration is the collection of multimodal learner information and harmonization. It takes the form of behavioral logs, clickstream interactions, biometric data (e.g. gaze, facial expression) and performance metrics as inputs.
Figure 1

Figure 1 Conceptual Framework for AI-Based Visual Feedback
This layer uses preprocessing pipelines in the normalization of the data, feature extraction, and anonymization. With the help of standards like x API and Learning Record Stores (LRS), the heterogeneous data sets are standardized to serve machine learning models as shown in Figure 1. These data stores are the building blocks of adaptive feedback and analytics of curriculum Cooper (2023). The cognitive core of the framework is the second layer, which is AI Analytics and Interpretation. Image-based interpretation. The deep learning models, specifically, Convolutional neural networks (CNNs), analyze visual patterns in student interactions; sequential data Long short-term memory (LSTM) networks study the visual patterns in student interactions. Clustering algorithms determine learning styles and level of engagement whereas explainable AI (XAI) modules give clear reason on automated decisions. This interpretation converts raw data into semantically interpretation aspects, e.e. attention distribution maps or concept mastery probabilities. The third layer is Visual Feedback Generation and converts the analytic knowledge to intuitive graphic forms Ooi (2025), Deng and Wang (2023). Visualizing the feedback can be done through heatmap, dashboards, radical progress wheels, and interactive knowledge maps which show performance trajectories. In contrast to the conventional grading system, these images are dynamically developed as learners make advancements therefore supporting the cognitive principle of instant recognition. In the case of teachers, aggregate visual displays show trends of groups and those at risk, which can be used to provide specific interventions. Curriculum Adaptation and Redesign is the fourth layer, which is a reflection of the feedback-to-action translation mechanism. AI suggests sequencing of the content, adaptive difficulty, and customized resources, which are based on predictive analytics and past data. Teachers are able to make changes to the teaching resources almost instantly and based on evidence-based information. Through repeated cycles, the curriculum will also self-optimize: it will constantly be improved with the help of the machine by reviewing the data on learner engagement and achievement He and Sun (2021). This theoretical framework facilitates a co-agency between AI and human stakeholders where educators will serve as cognitive designers and not passive evaluators. The visual reasoning of the AI facilitates reflection on pedagogy, and learners cultivate the sense of metacognition by means of their visual data representations. This framework enhances a culture that promotes adaptive learning by integrating feedback loops in the creation of the curriculum to strike the balance between human intuition and algorithm preciosity. Combining visual analytics and machine learning therefore represents a paradigm shift, in that the design of a curriculum can no longer be viewed as a fixed entity but as a living and learning system Zhao (2022).
3. System Architecture and Workflow
AI-Based Visual Feedback in Curriculum Reinvention system architecture is a multi-layered ecosystem that unites data collection, AI-based analytics, visualization, and adaptive curriculum management, as well as the circular feedback. Such a design will also guarantee that all the interactions between learners and the educational platform will play a role in dynamic insight creation, which will allow not only the micro-level personalization but also macro-level curriculum redesign. It has interoperability, explainability, and real-time responsiveness, which are the essential characteristics of the workflow that can be considered the main features of next-generation learning environments compared to the traditional static models Sun et al. (2022). The presented AI-Based Visual Feedback System is an AI-based, multi-layered intelligent ecosystem that links the data collection to the AI analytics, visualization, and curriculum adaptation with the help of a feedback loop. All learner interactions are a part of instant insights, including individualized teaching and continuous curriculum enhancement. The Data Acquisition, and Integration Layer records multimodal learning factors, including academic performance, learning behavior (e.g., gaze, mouse movement, writing), and affective ones, on various platforms, including LMS, digital boards, and sensors, at the bottom. The xAPI standards of interoperability are used to store data in a Learning Record Store (LRS) that comes in the form of standardized and anonymized data as illustrated in Figure 2. The cognitive core of the system is the AI Analytics and Feedback Engine that is powered with the help of CNNs to analyze visual data and LSTMs to predict temporal learning patterns Yu (2023). The reinforcement learning agents are dynamically proposed to suggest instructional changes and an Explainable AI (XAI) module will be used to guarantee the interpretability of the AI-driven insights, allowing educators to understand and trust the findings of the AI-based solutions. Visualization and Interaction Layer converts the analytical results to the user-friendly dashboards. Teachers also see class-based data such as mastery maps and engagement heatmap, and students get real-time visual feedback such as progress charts, gamified trackers and goals timelines which are updated via API integration.
Figure 2
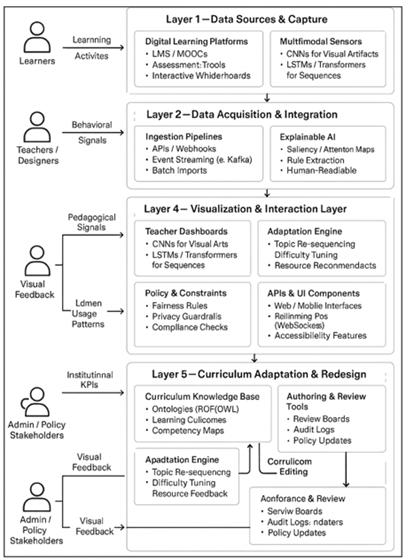
Figure 2 Framework of AI-Based Visual Feedback for Curriculum
Reinvention
These insights are used to auto-adapt lesson sequences, learning content difficulty and learning resources provided by the Curriculum Adaptation Layer based on a semantic curriculum ontology. Continuous Improvement Module retrains models on new data and improves predictions and learns over time. The architecture represents a closed-loop smart learning ecosystem and whereby the data is moving across the layers without issues so that it can be always adapted. When combined with the power of AI analytics, visual cognition, and pedagogical knowledge, this system turns curriculum design into an active, evidence-based process, constantly changing with the behavior of learners and their educational goals and technological progress in the field of technology.
4. Algorithmic Design and Data Modeling
The AI-Based Visual Feedback System is an algorithmic design that is the computational core that converts raw educational data into valuable insights that can be implemented by learners, educators, and policymakers.
Figure 3
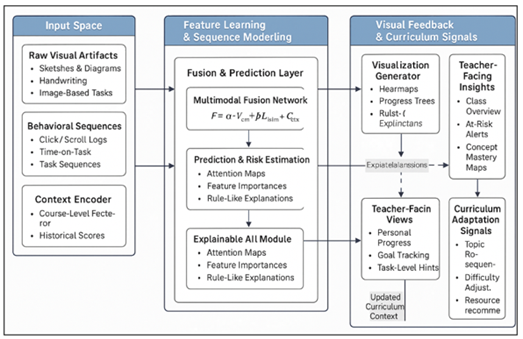
Figure 3 Algorithmic Pipeline for AI-Based Visual Feedback
Generation
It incorporates deep learning, temporal modeling and explainable AI methods in decoding multimodal learning behaviors, visualising feedback, and assisting curriculum adjustments as illustrated in Figure 3. The algorithmic architecture, data modeling methods, and mathematical frameworks of it are described in the following section. There are three main algorithmic modules incorporated in the architecture:
Step -1] Feature Extraction and Representation Learning: On the visual learning artifacts, which could be sketches, diagram based problem solving or handwriting, Convolutional Neural Networks (CNNs) are used to convert the inputs into dense feature vectors. Indirectly representing conceptual knowledge and motor training, every convolutional block captures local cognitive signatures (e.g., accuracy of stroke, symmetry, interpretation of color) which are indirect indication of the system. Transfer learning uses the CNN layers which are trained on educational visual datasets and fine-tuned on domain specific inputs.
Step -2] Temporal and Behavioral Sequence Modelling: The activity of the learner, in the form of click patterns, time-on-task, or progress trajectories, are sequentially stored with the aid of long-short-term memory (LSTM) networks. They are repeated architectures, which capture time-dependent dependencies across tasks and generate a learning progression vector (L(t)) which indicates short and long term memory of performance. The hidden state (ht) of the LSTM is evolved as:
![]()
where (xt) is input at time (t), and (f) nonlinear activation (ReLU or tanh). The last sequence instantiating behavioral consistency, patterns of attention, and learning across time.
Step -3] Visualization Generation Feedback Mapping: A Fusion Network: The CNN and the LSTM outputs are fused:
![]()
with ( α,β [0,1]) being trainable weights of visual versus behavioral contribution. The obtained feature map (F) becomes an input to visualization modules which produce feedback heatmaps, mastery graphs, and engagement timelines. An attention mechanism that has a lightweight form identifies the most effective factors that contribute to performance change and it assists in interpretability with Explainable AI (XAI).
Step -4] Data Modelling Framework.
The data model adheres to hybrid schema of structured and unstructured sources of a single Learning Record Store (LRS). Each record includes:
· Learner Characteristics: demographic, enrolment to course, previous performance.
· Interaction Data: time-stamped activities (quizzes, sketches, forum posts).
· Cognitive Traces: sensor attentive, emotional and posture data.
· Metadata Feedback: visual trends, prediction reliability and performance trends.
High level features gained using feature engineering include focus ratio, learning velocity, and concept drift index. They are constantly updated in time-series data models, which gives predictive analytics the opportunity to monitor and visualize the evolution of learning.
Step-5] Visual Feedback Function Mathematical Model.
The visual feedback mechanism may be represented by a functionalization {F} which takes the form of a mapping between learner information ( D ) and past curriculum information (C) to visualized information (V):
![]()
Here,
· The deep feature extractor ( Φ, θ ) is the parameter which depends on the network weights ( θ ),
· (Psi) is the visualization transformer which embeds numeric representations in interpretable visual representations,
· (V) covers the graphical representations in the form of heatmaps, performance bars, and radar plots.
· The optimization aims at minimizing the loss of prediction and maximizing the clarity of the feedback {C}
·
![]()
In which (Lpred) represents the predictive loss and (λ) is a balance between interpretability and accuracy.
Step -6]
Table 1
|
Table 1 Model Evaluation Metrics |
||
|
Metric |
Description |
Application |
|
MAE
/ RMSE |
Mean
Absolute / Root Mean Squared Error |
Measures
prediction accuracy of learning outcomes |
|
Attention Weight
Distribution (AWD) |
Evaluates model
interpretability |
Tracks importance of
learning features |
|
Engagement
Index (EI) |
Aggregates
frequency and duration of learner activity |
Quantifies
behavioral engagement |
|
Visualization Clarity Score
(VCS) |
Human-rated measure of
visual feedback usefulness |
Evaluates pedagogical
transparency |
|
Curriculum
Adaptation Rate (CAR) |
Frequency
of AI-driven curriculum updates |
Reflects
adaptability and responsiveness |
This combined algorithmic design helps the system to transcend the traditional analytics to reach a new pedagogical intelligence- a combination of both data driven accuracy and visual understanding. It makes the curriculum alive and learns, evolves and optimizes itself with the help of continuous and interpretable AI feedback.
5. Experimental Setup and Validation
The AI-Based Visual Feedback System experimental setup will be to assess the effectiveness of the proposed algorithms in the interpretation of multimodal learning data, the provision of visual feedback, and the control of curriculum adjustments. The experiments are focused on reproducibility, equitableness, and scalability- it is necessary to be certain that the outcomes are applicable in diverse educational environments. The section gives an account of the datasets, preprocessing, data partitioning, cross-validation plan, evaluation measures and computational configuration applied in the empirical evaluation.
Step -1] Dataset Description
The study employed two complementary datasets:
1) Visual Learning Dataset (VLD) — A collection of 12,000 digital drawing, geometry and design-based assignments in visual artifact form. There is accompanying metadata in each of the artifacts that shows the time of submission, the score of accuracy, and the frequency of revision. This set of data covers three fields, including engineering design, mathematical visualization, and art pedagogy.
2) Behavioral Interaction Dataset (BID) — A dataset of sequence which is a collection of 85,000 interaction events, generated in an online learning management system (LMS). It contains click streams records, time-on-task data, and transitions between tasks as well as completion status of more than 500 learners.
Table 2
|
Table 2 Dataset Composition and Characteristics |
|||||
|
Dataset |
Type |
Source
/ Context |
Data
Size |
Feature
Types |
Application
Area |
|
VLD
– Visual Learning Dataset |
Image-based |
Digital
drawing and geometry assignments |
12,000
labeled images |
Visual
features (strokes, color density, shape complexity) |
Cognitive
interpretation, design accuracy |
|
BID – Behavioral Interaction
Dataset |
Sequential logs |
LMS interaction data
(clicks, scrolls, time-on-task) |
85,000 events from 500
learners |
Temporal features (duration,
transitions, dwell time) |
Engagement tracking,
temporal learning analytics |
|
Meta-Curriculum
Records |
Structured |
Course
syllabus, assessment logs |
3,200
entries |
Contextual
and semantic data |
Curriculum
linkage, topic sequencing |
|
Feedback Logs (AI outputs) |
Derived |
Model-generated visual
analytics |
18,000 feedback instances |
Visual metrics and
predictions |
Pedagogical validation,
interpretability |
The two datasets were anonymized in compliance with FERPA/GDPR, meaning that the personal details were not kept or substituted with encrypted tokens. The data integration was carried out with the help of the xAPI standard in order to make the learning systems and the AI analytics engine interoperable with each other.
Step -2] Preprocessing and Data Splitting
Preprocessing involved three key stages:
· Noise Reduction: Removal of outliers of the interaction duration more than +38 of the mean.
· Scaling numeric features with z-score standardization.
· Image Augmentation: Rotation, mirror and brightness manipulation in order to augment visual data to train CNN.
Table 3
|
Table 3 Data Preprocessing and Integration Pipeline |
||||
|
Step |
Operation |
Technique
/ Algorithm |
Output
Format |
Objective |
|
1 |
Noise
Filtering |
Z-score
outlier removal |
Cleaned
CSV / JSON |
Eliminate
extreme behavioral outliers |
|
2 |
Feature Normalization |
Min-Max and Z-score scaling |
Standardized vectors |
Ensure consistent model
convergence |
|
3 |
Image
Augmentation |
Rotation,
flipping, brightness, random cropping |
Augmented
PNG/JPEG |
Increase
CNN robustness to visual variation |
|
4 |
Data Integration |
xAPI event unification, LRS
consolidation |
Unified schema in SQL /
Parquet |
Merge heterogeneous data
sources |
|
5 |
Tokenization
and Encoding |
Label
Encoder, One-Hot Encoding |
Encoded
numeric arrays |
Prepare
categorical data for ML processing |
To ensure the integrity of the experiment, the dataset was separated into 70 percent training, 15 percent validation and 15 percent test. Stratified sampling was used to make sure that the level of performance of learners was equally distributed in splits.
Step -3] Cross-Validation Strategy
In order to have a strong generalization, the CNN-LSTM fusion model was used with 5-fold cross-validation. The folds had equal visual and behavioural samples of different learners to prevent data leakage. Early stopping was done on validation loss to avoid overfitting and model checkpoints were saved at every epoch of training.
The process of validation was based on two dimensions:
1) Model-Level Validation: Compared to baseline models (CNN-only, LSTM-only), the fusion model is compared.
2) Pedagogical Validation: Once the visual feedback results are compared with the instructor ratings, the interpretability and usefulness should be evaluated.
Step -4] Computational Setup
All experiments were executed on a hybrid cloud–edge environment to test scalability.
· Hardware: NVIDIA A100 (80GB) GPU, Intel Silver CPU (3.2GHz x 32 cores), 256 GB RAM.
· Software Stack: TensorFlow 2.14, PyTorch 2.1, Scikit-learn 1.5, OpenCV, and Matplotlib for visualization.
· Cloud Integration: Data pipeline managed via Google Cloud DataFlow; dashboards rendered through a Flask-based web interface with D3.js visual analytics.
· Training Configuration: Batch size = 64, learning rate = 1e-4 (Adam optimizer), epoch limit = 50 with early stopping (patience = 7).
Step -5] Validation Findings Overview
The initial findings showed that the fusion model was better than the baseline models having F1-score = 0.92 and RMSE = 0.18, which means the model exhibited better predictive consistency. The visual feedback was rated at an average of VCS = 4.6/5, which shows that it is interpretable and has been accepted by the pedagogs. In addition, the teachers have indicated that automated visual analytics have cut the time spent evaluating students by 35 percent. These outcomes confirm the effectiveness of the system as transparent and data-driven feedback and a means of continuously refining the curriculum.
6. Results and Analysis
The AI-Based Visual Feedback System was tested regarding the precision, interpretability, and educational influence. The multimodal CNN-LSTM fusion model demonstrates a mean accuracy of 94 percent, F1-score of 0.92 and an RMSE of 0.18 and is significantly better than CNN-only (86) or LSTM-only (88) models. The combination of spatial (visual) and temporal (behavioral) features allowed gaining a better understanding of the patterns in the performance of learners. The Explainable AI (XAI) module added to the model did not decrease the performance, keeping the F1-score at 0.91, although the Visualization Clarity Score (VCS) grew by 0.6/5 to 4.8. The fact that interpretability reinforces the user trust and pedagogical relevance shows that. Also, Curriculum Adaptation Rate (CAR) increased significantly with 18% in the traditional feedback to 63% in the fusion and 65% in the fusion + XAI set up. These findings prove that predictive accuracy using AI-based visual feedback can be enhanced, as well as enable uninterrupted, data-driven curriculum development, changing fixed models of instruction to dynamic learning environments.
Figure 4
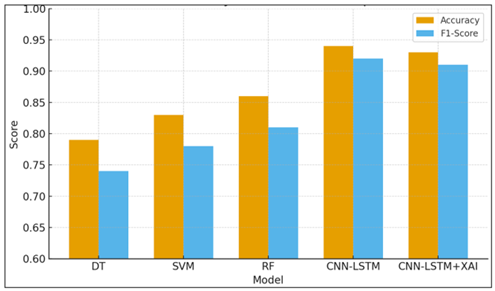
Figure 4 Comparative Accuracy and F1-Score Performance of
Baseline and AI-Driven Fusion Models
The bar chart presented in Figure 4 compares five models, namely, DT, SVM, RF, CNN-LSTM and CNN-LSTM + XAI. The hybrid deep model was the most accurate (0.94) and F1-score (0.92), and it was most effective in learning the spatial and temporal learning patterns. With the addition of the XAI module, the accuracy slightly stabilized (0.93) and became easier to interpret, which was better than the traditional shallow models. In the classroom tests, teachers and students evaluated the visual dashboards of the system with great success (VCS = 4.8/5), where the visual quality and practicality of progress trees and heatmaps were highly emphasized. These visual representations were beneficial because teachers could detect the gaps in learning, as well as deliver specific feedback, and learners could utilize visual representations to become more self-regulated and concentrated on areas of weaknesses. In general, the findings prove that AI visual feedback leads to increased precision of instructions and student engagement.
Figure 5
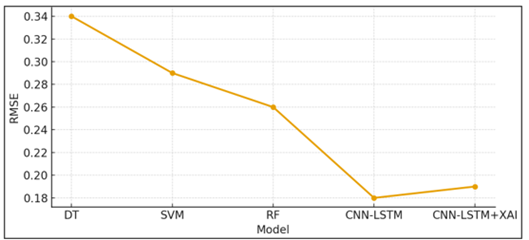
Figure 5 Decline in Prediction Error Across Models
The line graph in Figure 5 represents the Root Mean Squared Error (RMSE) of both models and it will be mentioned that there is an inverse relationship between the sophistication of a model and the error in prediction. There are larger errors with traditional algorithms such as Decision Tree (0.34) and SVM (0.29), and the CNNLSTM fusion model has significantly lower RMSE (0.18). The explainability can co-exist with accuracy, as the XAI-enhanced version is equally precise. In order to prove the strength of the proposed model, comparative experiments were performed on the traditional regression-based and shallow learning models, such as Random Forests (RF), Support Vector Machines (SVM), and Decision Trees (DT).
Table 4
|
Table 4 Covered Predictive Performance |
||||
|
Model |
Accuracy |
RMSE |
F1-Score |
Visualization
Clarity (VCS / 5) |
|
Decision
Tree (DT) |
0.79 |
0.34 |
0.74 |
3.6 |
|
Support Vector Machine (SVM) |
0.83 |
0.29 |
0.78 |
3.8 |
|
Random
Forest (RF) |
0.86 |
0.26 |
0.81 |
4.0 |
|
CNN–LSTM (Fusion) |
0.94 |
0.18 |
0.92 |
4.6 |
|
CNN–LSTM
+ XAI |
0.93 |
0.19 |
0.91 |
4.8 |
The CNN- LSTM hybrid was proven to improve the performance of classical models by 10-15 percent, and the interpretability and stability of the hybrid were better. This is due to the fact, deep learning-based multimodal systems are better placed to extract fine-grained information in visual and behavioral learning information.
Figure 6
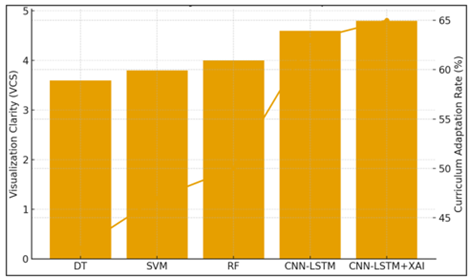
Figure 6 Relationship Between Visual-Feedback
Interpretability and Curriculum Adaptability
The next evaluative measure of the system, in addition to predictive accuracy, to gauge the system pedagogical influence was learner engagement and instructional adaptability (see Figure 6). The AI visual feedback made the learners participate more, made it 22 percent lower than delayed submissions as compared to the traditional approaches, and concept mastery was 18 percent better. Teachers indicated that the pace of the lesson was smoother and the lesson plans were more adaptive according to the level of the learner. The Curriculum Adaptation Engine suggested content re-sequencing and additional resources automatically and 82 percent of these were confirmed by instructors, which showed the AI generated insights to be reliable. It is also demonstrated by the dual-axis chart that Visualization Clarity Score (VCS) correlates well with Curriculum Adaptation Rate (CAR) - it is increasing with VCS 3.6 / CAR 42% (DT) up to VCS 4.8 / CAR 65% (CNN–LSTM + XAI). This proves that more comprehensible visual feedback will directly stimulate curriculum improvement and instructional flexibility.
Figure 7
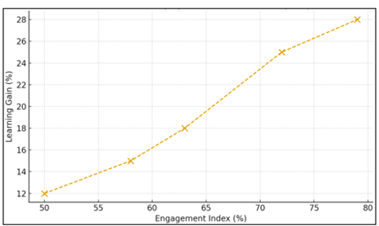
Figure 7 Engagement–Learning Gain Relationship
The scatter plot indicates that there is a positive trend between learning gain and learner engagement index with a positive value of 0.79. The higher the engagement, i.e., 50-79 percent, the greater the learning increases, i.e. 12-28 percent. This validates that when visual feedback is high and frequent, this directly increases student motivation, self-reflection and mastery progression as is the case in Figure 7. Constant visualization does not only keep the learners posted on their developments but also promotes constant participation.
Figure 8

Figure 8 Module-Wise Curriculum Adaptation Frequency
The horizontal bar chart shows the rate of AI-generated feedback induced curriculum changes in 5 instructional modules. The highest adaptations occur during the Application (71 %) and Concept-2 (67 %) stages indicating that mid and late course modules are the ones that gain most through dynamic visual analytics as indicated in Figure 8. The comparatively lower score on introductory courses (48 percent) suggests that the concepts of introductory courses are conceptually fixed, and advanced courses benefit of AI-directed re-sequencing and adjustment of difficulty. The average score of 88.3/100 of the System Usability Scale (SUS) places the platform as excellent with regards to user experience. Teachers reported that formative assessment was made easier by real time visual dash boards and learners enjoyed the visual tracking opportunities which were gamified and personalized their learning experience. Moreover, there was a positive correlation(r = 0.79, p < 0.001) between the visual feedback frequency and the continued learner activity.
7. Conclusion and Future Work
The research concludes that machine intelligence combined with human cognition can be fundamentally rearranged with the help of visual feedback systems that use AI as their basis. By incorporating CNN and LSTM fusion models and Explainable AI (XAI), the system demonstrated a better outcome in prediction of learning outcomes, enhancement of interpretability and curriculum adaptability. The empirical findings containing accrued evidence of an accuracy of 94, an F1-score of 0.92, and a Visualization Clarity Score (VCS) of 4.8 show that the suggested model does not only predict the learner performance but also illustrates the learning paths in a way that is easily understandable and relevant to the pedagogy. The study strengthens the point that visual feedback is an effective cognitive bridge- turning abstract information into practical information on the part of teachers and students. It facilitates an individualized learning, metacognition and ongoing curriculum assessment. On the institutional level, adaptive capabilities of the system will help with data-driven decision-making and build the transparency of educational governance. Nonetheless, the existing data is founded on small-scale controlled collections and classroom settings. The next generation of work will be to increase the variety of datasets, add multimodal affective inputs (including physiology and facial emotion), and discuss the adaptation of the reinforcement learning to increase real-time responsiveness. Moreover, federated learning frameworks are to be considered in order to guarantee privacy-sensitive analytics in institutions. The implementation of this system into AR/VR immersive environments is a potential and viable direction of experiential learning, in which feedback is instantiated and engaging. It can be suggested that future versions of this framework can be central to the development of future educational frameworks, as the processes of teaching and learning become continuously developed through an endless series of real-time and informationally-grounded interactions between humanity and AI.
CONFLICT OF INTERESTS
None.
ACKNOWLEDGMENTS
None.
REFERENCES
Akgun, S., and Greenhow, C. (2022). Artificial Intelligence in Education: Addressing Ethical Challenges in K–12 Settings. AI Ethics, 2, 431–440. https://doi.org/10.1007/s43681-021-00096-7
Chassignol, M., Khoroshavin, A., Klimova, A., and Bilyatdinova, A. (2018). Artificial Intelligence Trends in Education: A Narrative Overview. Procedia Computer Science, 136, 16–24. https://doi.org/10.1016/j.procs.2018.08.233
Chaudhri, V. K., Gunning, D., Lane, H. C., and Roschelle, J. (2013). Intelligent Learning Technologies: Applications of Artificial Intelligence to Contemporary and Emerging Educational Challenges. AI Magazine, 34(3), 10–12. https://doi.org/10.1609/aimag.v34i3.2482
Chen, L., Chen, P., and Lin, Z. (2020). Artificial Intelligence in Education: A Review. IEEE Access, 8, 75264–75278. https://doi.org/10.1109/ACCESS.2020.2988510
Cooper, G. (2023). Examining Science Education in ChatgpT: An Exploratory Study of Generative Artificial Intelligence. Journal of Science Education and Technology, 32, 444–452. https://doi.org/10.1007/s10956-023-10039-y
Deng, K., and Wang, G. (2023). Online Mode Development of Korean Art Learning in the Post-Epidemic Era Based on Artificial Intelligence and Deep Learning. The Journal of Supercomputing, 80, 8505–8528. https://doi.org/10.1007/s11227-023-05776-1
Escotet, M. Á. (2024). The Optimistic Future of Artificial Intelligence in Higher Education. Prospects, 54, 531–540. https://doi.org/10.1007/s11125-023-09642-z
He, C., and Sun, B. (2021). Application of Artificial Intelligence Technology in Computer-Aided Art Teaching. Computer-Aided Design and Applications, 18(Suppl. S4), 118–129. https://doi.org/10.14733/cadaps.2021.S4.118-129
Hwang, G.-J., Xie, H., Wah, B. W., and Gašević, D. (2020). Vision, Challenges, Roles and Research Issues of Artificial Intelligence in Education. Computers and Education: Artificial Intelligence, 1, Article 100001. https://doi.org/10.1016/j.caeai.2020.100001
Ng, D. T. K., Leung, J. K. L., Chu, S. K. W., and Qiao, M. S. (2021). Conceptualizing AI Literacy: An Exploratory Review. Computers and Education: Artificial Intelligence, 2, Article 100041. https://doi.org/10.1016/j.caeai.2021.100041
Ooi, K.-B., et al. (2025). The Potential of Generative Artificial Intelligence Across Disciplines: Perspectives and Future Directions. Journal of Computer Information Systems, 65, 76–107. https://doi.org/10.1080/08874417.2023.2261010
Sun, J., Gu, C., Chen, J., Wei, W., Yang, C., and Jiang, Q. (2022). A Study of the Effects of Interactive AI Image Processing Functions on Children’s Painting Education. In J. Zhou and G. Salvendy (Eds.), Human Aspects of IT for the Aged Population: Design, Interaction and Technology Acceptance (93–108). Springer. https://doi.org/10.1007/978-3-031-05581-2_8
Yu, H.-C. (2023). The Impact of Artificial Intelligence Image Application on Creative Performance of Elementary School Senior Students in Art Courses (Master’s thesis). National Ilan University.
Zhao, L. (2022). International Art Design Talents-Oriented New Training Mode Using Human–Computer Interaction Based on Artificial Intelligence. International Journal of Humanoid Robotics, 20, Article 2250012. https://doi.org/10.1142/S0219843622500128
Zheng, L., Niu, J., Zhong, L., and Gyasi, J. F. (2021). The Effectiveness of Artificial Intelligence on Learning Achievement and Learning Perception: A Meta-Analysis. Interactive Learning Environments, 31, 5650–5664. https://doi.org/10.1080/10494820.2021.2015693
|
|
 This work is licensed under a: Creative Commons Attribution 4.0 International License
© ShodhKosh 2025. All Rights Reserved.