ShodhKosh: Journal of Visual and Performing ArtsISSN (Online): 2582-7472
|
|
Performance Data Analytics for Music Institutions
Subhash Kumar Verma, 1![]() , Varalakshmi Dandu 2
, Varalakshmi Dandu 2![]()
![]() ,
Debanjan Ghosh 3
,
Debanjan Ghosh 3![]()
![]() ,
Sasmeeta Tripathy 4
,
Sasmeeta Tripathy 4![]()
![]() ,
Abhiraj Malhotra 5
,
Abhiraj Malhotra 5![]()
![]() ,
Varun Ojha 6
,
Varun Ojha 6![]()
![]()
1 Professor
School of Business Management, Noida International University 203201, India
2 Assistant
Professor, School of Management, Presidency University, Bangalore, Karnataka,
India
3 Assistant Professor, Department of Computer Science and IT, ARKA JAIN
University Jamshedpur, Jharkhand, India
4 Associate Professor, Department of Mechanical Engineering, Institute of Technical Education and Research, Siksha 'O' Anusandhan (Deemed to be University) Bhubaneswar, Odisha, India
5 Centre of
Research Impact and Outcome, Chitkara University, Rajpura- 140417, Punjab,
India
6 Chitkara Centre for Research and Development, Chitkara University,
Himachal Pradesh, Solan, 174103, India
|
|
|
ABSTRACT |
|
|
Potential to
transform the music education system the use of data analytics in music
education has the potential to radically transform the performance, pedagogy,
and institutional effectiveness assessment system. The given paper will
provide a detailed Performance Data Analytics framework, which will be used
in the environment of the music institutions, considering both academic and
artistic sides of the performance. It also discusses the way different
sources of data (student assessment, the documentation of recitals, student
attendance, peer rating, etc.) can be analyzed systematically towards
arriving at actionable information. The research employs mixed research model
that is a blend of the quantitative analysis that is using statistics, and
the qualitative interpretation, in order to measure the performance outcomes.
The computation and graphical representation of complicated data patterns are
done in Python, R, SPSS, and Excel. The systematic analysis of the literature
shows a lack of domain-specific analytics models in music education where the
traditional data evaluation practices do not take into account data-driven
insights. The suggested analytics framework proposes some Key Performance
Indicators (KPIs) peculiar to musical performance including technical
mastery, expressive interpretations, teamwork, and temporal stability. An
example of this framework application with the help of selected music
institutions to case study gives the evidence of correlations between the
teaching methods, practices, and performance development. |
|||
|
Received 01 February 2025 Accepted 23 April 2025 Published 16 December 2025 Corresponding Author Subhash
Kumar Verma, dir.sbm@niu.edu.in DOI 10.29121/shodhkosh.v6.i2s.2025.6696 Funding: This research
received no specific grant from any funding agency in the public, commercial,
or not-for-profit sectors. Copyright: © 2025 The
Author(s). This work is licensed under a Creative Commons
Attribution 4.0 International License. With the
license CC-BY, authors retain the copyright, allowing anyone to download,
reuse, re-print, modify, distribute, and/or copy their contribution. The work
must be properly attributed to its author.
|
|||
|
Keywords: Music
Education Analytics, Performance Evaluation, Key Performance Indicators (KPIs),
Data-Driven Learning, Educational Data Mining, Institutional Performance
Metrics |
|||

1. INTRODUCTION
The application of data analytics in the area of performance evaluation is not that widespread within the field of music education yet. The typical qualitative measures used in music institutions, conservatoires, academies, or departments of music schools have traditionally been jury assessments, recitals, or instructor ratings to determine the performance of students. Whereas such processes are useful in providing artistic information, they do not often provide adequate quantitative information to make evidence-based decisions. The inclusion of data analytics will provide an opportunity to unite artistic evaluation and empirical precision when integrated, which will enable viewing the progress of the music and institutional success as a whole. The liquid side of music performance that implies the technical skill, the emotionality, the ingenuity, and the collaboration presents specific issues of evaluation Cui et al. (2022). The degree of these competencies might not be captured comprehensively by the traditional grading system or performance reviews. By the introduction of data-related approaches, music institutions can analyze trends in many different dimensions: how music is practiced among students, how varied the repertoire is, how often recitals are held, how often students play in an ensemble, how they attend, how they respond to their peers or audience, etc. to form an eye-opening perspective of the learning patterns Ferdiana et al. (2022).
The analytics of data allow identifying key performance
indicators (KPIs) that can capture both artistic and academic improvement and,
therefore, establish measurable standards of continuous improvement. Moreover,
the increasing availability of digital tools and programs, including Python, R,
SPSS, and Excel, allows the teacher to gather, calculate, and present
performance data much more effectively Ghosh
et al. (2022). These tools
facilitate predictive modeling, sub-grouping, and
analysis of correlation whereby institutions can learn the connection between
practice hours, teaching practices and performance results. These can be used
to inform curriculum creation, resources distribution and even student-specific
feedback. As an example, such data as digital learning management system,
online practice logs, or performance tracking apps may be reviewed to determine
the strengths, weaknesses, and pedagogical intervention areas. Although these
are the possibilities, historically, music education has been behind other
subjects in terms of the analytical methodology Pyrovolakis et al. (2022). A large part of the
studies on educational data mining is devoted to such areas as STEM, business,
or social sciences where the metrics can be more readily quantified Xia
and Xu (2022).
2. Literature Review
2.1. Overview of data analytics applications in education
Analytics has extensively been used in the traditional academic setting as a way of tracking student progress, anticipating the at-risk learners, and tailoring the learning process with adaptive systems. As an example, educational data mining and learning analytics have enabled timely interventions and enhanced the academic performance through the transformation of raw data into action Han et al. (2023). The advent of the big data technologies has widened the scope of the analytics further, as educational institute is now able to utilize vast amounts of data that includes demographic, behavioral, and cognitive layers Duman et al. (2022). Modern tools of analysis (regression models, clustering, and machine learning) are used to assist institutions in identifying trends, evaluating progress, and predicting performance. Also, these insights are available to educators and administrators through dashboards and visualization tools to enable them make timely decisions Khan et al. (2022).
2.2. Previous studies on performance evaluation in music institutions
Traditional music education performance evaluation has been based on subjective assessment modes such as the jury, recitals, teacher evaluation. Such methods are more qualitative in nature in terms of expression, tone, creativity, and stage presence. As much as they can be useful in their feedback, they do not offer the necessary consistency and objectivity that is needed in institutional benchmarking and long term tracking Zheng (2022). Past studies in the field of music pedagogy have analyzed performance using psychological, cognitive, and pedagogical perspectives- questioning the issue of motivation, practice, and feedback as a factor in artistic development. Nonetheless, few studies have used analytical or quantitative research designs to measure musical performance in a systematic way. A few of the works of this kind have tried to fill this gap by integrating technology into the analysis of music performance Majidi and Toroghi, (2023). As an example, physical techniques are studied with the help of digital platforms and motion-capture systems, and the accuracy of pitch, time, and control of dynamics are measured with the help of software that analyses sound. Some authors have proposed performance rubrics that are a mix of a subjective rating scale and a numerical score, which form semi-quantitative assessment schemes. That said, the implementation of data analytics models in music institutions is insignificant. The majority of the research is on the assessment of individual skills and does not evaluate institutional or program-wide performance measurement Yang (2022).
2.3. Gaps in existing research
Despite the popularity of educational data analytics, the use of this tool in the field of music performance evaluation has yet to be integrated and developed. Most studies focus on conventional evaluation styles or technology-based instruction and do not fully use data analytics to enable continuous improvement of performance. The first gap is the lack of standardized performance indicators (KPIs) in the specific fields of music Dai et al. (2024). In comparison with academic subjects, where grades or test scores can be measured rather easily, music education incorporates such complicated aspects of interpretation, creativity, collaboration, and emotional expression which cannot be measured by the traditional tools. Moreover, institutional-level analytics in music education is hardly used by current research. The majority of them are based on individual learning instead of programmatic performance trends or faculty impact analysis Kasif et al. (2024). This constraint prevents music institutions from measuring their overall performance and determine systemic bottlenecks or make judgments based on data. Table 1 presents the summary of studies on performance data analytics in education, music. The other gap that needs to be mentioned relates to the incorporation of various data sources, including the following ones: recital recordings, digital learning platforms, practice logs, and student feedback, into coherent analytical systems Flieder (2024). Valuable insights will be in the silos unless they are united under cohesive data structures.
Table 1
|
Table 1
Summary of Related Work on Performance Data Analytics in Education and Music |
||||
|
Domain |
Sample Size |
Tools/Techniques Used |
Key Findings |
Identified Gap |
|
General Education |
120 studies |
Data mining, ML |
Analytics improve student retention |
No focus on creative arts |
|
Education Management |
25 institutions |
SPSS, R |
Predictive models identify at-risk students |
Lack of performance arts data |
|
Music Education Qian et al. (2025) |
85 students |
LMS Analytics |
Online engagement improves learning outcomes |
Limited performance metrics |
|
Performing Arts |
60 participants |
Survey, Observation |
Subjective evaluation dominates arts |
No quantitative KPIs |
|
Data Analytics Gu and Dao (2023) |
10 schools |
Tableau, Excel |
Dashboards aid institutional monitoring |
No artistic context |
|
Music Performance |
40 students |
Regression, ANOVA |
Practice frequency predicts outcomes |
Small dataset size |
|
Multidisciplinary Dao and Gu (2024) |
15 institutions |
Python, SVM |
ML enhances performance prediction |
No creative domain coverage |
|
Music Psychology |
50 performances |
Audio Analysis, NLP |
Tone and tempo reflect expressiveness |
No integration with institutional analytics |
|
General Education |
500 students |
SPSS, Correlation |
Attendance linked to achievement |
Limited to theory subjects |
|
Music Institutions |
70 students |
Rubric Analysis |
Hybrid rubrics improve fairness |
No automated data processing |
|
AI and Learning |
200 records |
Deep Learning |
Predicts learning outcomes accurately |
Not domain-specific |
|
Music Psychology |
90 learners |
Survey, Interviews |
Motivation affects performance quality |
No statistical analytics |
|
Arts Education |
110 students |
SPSS, Excel |
Quantitative KPIs improve objectivity |
Narrow focus on visual arts |
3. Methods and Materials
3.1. Population and sampling (students, teachers, institutions)
The target population of the study consists of students, teachers and administrators of the chosen music institutions that provide formal training in the instrumental, vocal and theoretical fields. The sampling strategy is stratified random sampling strategy which is to have an equal representation of different categories- such as the level of performance, the type of instrument and the specialization of teaching. Learners in the beginner, intermediate and advanced levels were chosen to represent different learning patterns and performance patterns. In the same manner, the teachers who have different years of experience and background in the pedagogical process were incorporated to examine the instructional influence on the student outcomes. The institutions that were involved in the study were selected according to their willingness to implement the data-driven systems and the availability of digital records of the performance. They included both the public and the private music institutions to provide diversity in the structure and resource of the organization. The sample population amounted to about 150 students and 25 instructors in three institutions. All the participants provided informed consent and ethical considerations of confidentiality of the data and academic integrity were upheld. Population distribution and sampling structure of music institutions is depicted in Figure 1 below. The data obtained covers a period of one academic year, and it includes student assessments, recital scores, attendance, and recordings of digital performances.
Figure 1

Figure 1 Population and Sampling Structure of Music Institutions
This sampling design will provide the full coverage of the variables that affect the performance outcomes and will be representative in various demographic and institutional settings.
3.2. Materials and instruments (software tools, survey forms, data collection systems)
The quantitative and qualitative data collection tools were used to record the multifaceted nature of the musical performance. Survey questionnaires were considered the main materials as they were aimed at collecting data on practice habits, learning preferences, and instructor feedback. The surveys were sent online with the help of electronic forms because it is more convenient and all data are aggregated. In order to supplement the self-reported data, academic departments were contacted and obtained institutional records that include recital evaluation, attendance records and performance grades. Technology devices were essential in the objective measurement of performance data. Audio and video recordings of recitals and practice sessions were studied to evaluate such measurable parameters of performance as timing precision, pitch, and dynamic control. The learning management systems (LMS) offered more information regarding the involvement of students, submission, and feedback loop. Additionally, such software as Excel and Google Forms were used to enter the data, code it, and perform initial categorization. There was an installed data collection system which was used to harmonize information in various sources into a single database. This system guaranteed accuracy of data, reduced redundancy and also facilitated longitudinal follow up of student progress.
3.3. Statistical and analytical tools used (e.g., Python, R, SPSS, Excel)
The analysis of the performance data was done using the combination of statistical, computational, and visualization tools. Demographic data and overall trends of performance were summarized using descriptive statistics, such as mean, SD, and frequency distributions. The inferential statistics, including the correlation analysis, regression analysis, and analysis of variance (ANOVA), were applied to explore the interaction between such variables as practice frequency, instructional methods, and performance results. The data was processed and analyzed with the help of software tools such as Python, R, SPSS, and Microsoft Excel. Python and R were used to support high-level statistical modeling and machine learning, such as to cluster students according to performance trends, and to model predictors according to the patterns of improvement. The statistical testing interface in SPSS was easy to use whereas data visualization in Excel was done using charts and pivot tables. In the case of qualitative data, e.g., open-ended survey answers and instructor observations, content analysis methods were used in Python with the help of the Natural Language Toolkit (NLTK). Dashboards to show the correlation of variables and institutional performance indicators were created with visualization libraries such as Matplotlib and Tableau. It was done through data cleaning and normalization to provide accuracy and inter-rater consistency.
4. Data Analytics Framework for Music Institutions
4.1. Key performance indicators (KPIs) for music performance
It is necessary to define Key Performance Indicators (KPIs) in order to measure artistic and academic achievements in music institutions. As opposed to traditional subjects, music performance is multidimensional, using skills, which are technical, expressive, and interpretive, and it demands a well-thought indicator that is equal in its qualitative and quantitative aspects. The proposed research finds KPIs that assess the performance in a broad perspective, both in measurable results and taking into consideration artistic subtlety. On the student level, KPIs are technical accuracy (intonation, precision in rhythm, and dynamics), creativity of interpretation, the complexity of the repertoire, the involvement in the ensemble, and development over time. These measurements are complemented with attendance, practice time and instructor reports to give some background to skill acquisition. Other factors that facilitate the measurement of holistic performance are academic indicators that include theory grades and recital evaluations. KPIs revolve around instructional effectiveness, rate of improvements in student performances, quality of feedback and teaching innovation in the case of teachers.
4.2. Data sources
Peer feedback reports and instructor evaluations are an addition to these quantitative data to provide a full picture of the growth in students through qualitative observation. Data regarding the administrative issues of scheduling, grades and feedback loops are stored in a type of institutional system known as Learning Management Systems (LMS) and performance management systems. Longitudinal tracking and cross-variable comparison can be performed by integrating these different datasets in a centralized system of analysis. The framework allows the combination of structured (numerical) and unstructured (textual or audiovisual) data and view the results of individual and institutional performance in a comprehensive and data-driven manner.
4.3. Analytical models and algorithms used
The analytical part of the framework uses a statistical model of interpretation of the data collected, machine learning models, and visualization models. First, the descriptive analytics can be utilized to present performance data summarizing, averaging, and pointing out time-related trends. This step will give a background knowledge of the dataset and assists in identifying an outlier or anomaly in student progress. Then, diagnostic analytics can apply correlation and regression models to find out the relationship between variables (e.g., the relationship between practice hours and recital scores or between attendance and technical improvement). The analyses expose causal trends, which shape specific pedagogical interventions. Predictive analytics utilizes machine learning algorithms, which include linear regression, decision trees, and clustering, to predict the performance trajectories going forward. Indicatively, the clustering algorithms can be applied to cluster students with similar learning behavior and the regression model can be used to forecast the performance results depending on the frequency of practice and teacher feedback. Support vectors machines (SVM) classification algorithms are applied to classify the level of performance quality.
5. Case Study / Implementation
5.1. Description of selected music institution(s)
The case research was carried out in two large-scale music schools, which included Harmony School of Music and Crescendo Conservatory, due to their focus on the implementation of digital devices in pedagogy. The two institutions also provide organized courses in instrumental, vocal and theoretical courses with students of beginner, intermediate, and advanced levels. They have a performance-driven curriculum, frequent testing, and recitals, which makes them ideal candidates to the data-driven analysis. With 400 students and 30 faculty, the Western classical and contemporary genres, the Heritage School of Music is active in the harmony school. The school also has an online learning management system (LMS) and an online digital library of recitals recordings. As Figure 2 presents, the protocol of music institutions that were involved in the study. Crescendo Conservatory, conversely, has approximately 250 students and 20 teachers whose focus is on Indian classical and fusion music. It also embraces new technologies, such as digital metronomes, performance tracking applications and peer evaluation technology.
Figure 2
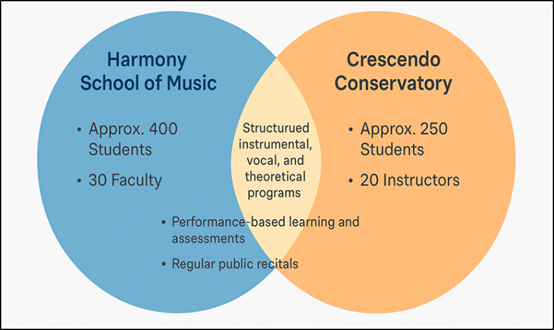
Figure 2
Overview of Participating Music Institutions in the
Study
Both of the institutions have aligned data records across semesters, which makes them reliable and longitudinally deep in the case of analysis. The facilitating environment of their experimentation concerning pedagogy and uptake of technology contributed to experimenting with the proposed Performance Data Analytics Framework. The study ensured a representative balance of artistic variety and institutional flexibility by choosing institutions with different musical focus but a common pattern of educational organization, which is the key to the comprehension of how analytics can be successfully implemented in different settings of music education.
5.2. Application of analytics framework
The Performance Data Analytics Framework implementation was implemented in a multi-stage process consisting of data collection, preprocessing, analysis, and visualization. They were used to extract data on institutional databases such as student performance assessment, attendance history, recording of recitals and instructor comments. All the datasets were cleaned, normalized and coded so that they were similar in all the two institutions. Descriptive and inferential analyses were conducted on Python and R to determine patterns and correlations of performance. As an example, the linear regression models were used to analyze the correlation between the frequency of practice and recital performance and clustering algorithms grouped students according to learning patterns and improvement rates. Another area where SPSS was useful was in comparative statistical testing (ANOVA) to compare the performance difference between the levels of students, as well as the teaching methods. Signal processing was used to evaluate timing accuracy and pitch accuracy of audio recordings. Linguistic information, e.g. instructor comments and student thoughts, were handled with natural language processing (NLP) to identify common themes of enhancement, inspiration and artistic expression. The data visualizations thus obtained were tabulated into interactive dashboards with Tableau to enable administrators and faculty monitor progress through KPIs in real-time. There were created feedback loops in which teaching changes and student mentoring were based on the insights obtained in the analytics.
5.3. Data insights and findings
The application provided profound information on the effectiveness of data analytics on performance assessment in music schools. The results of the analysis showed that there were positive correlations among consistent practice hours, attendance and performance improvement. Students who had a higher level of engagement (measured by the attendance and practice logs) had up to 25% higher recital scores than irregular participants.
6. Result and Discussion
This comparison indicated that there were strong positive relationships between regular practice, attendance, and recital performance. The technical and expressive results of students who practiced in a structured manner and participated in an ensemble showed better results. Predictive models were very effective in correctly identifying learners who needed intervention, which improved instructional efficiency. Educators who provided information based on data feedback indicated more increase in students. Analytics were adopted in an institutional context which made assessment more transparent and strategic.
Table 2
|
Table 2 Correlation between
Practice Habits, Attendance, and Recital Performance |
|||
|
Variable |
Mean Score (%) |
Std. Deviation |
Correlation with Recital
Score (r) |
|
Daily Practice Hours |
3.8 |
1.1 |
0.82 |
|
Weekly Attendance (%) |
92.4 |
6.3 |
0.78 |
|
Ensemble Participation
Frequency |
6.2 (sessions) |
2.5 |
0.74 |
|
Instructor Feedback
Frequency |
4.1 (per week) |
1 |
0.69 |
Table 2 reveals the quantitative correlation of different performance related aspects with the recital results among music students. These findings show significant positive relationships among practice hours (daily) and recital scores (r = 0.82) and that practice is the most notable determinant of quality of musical performance, in case it is regular and disciplined. Statistic relationship between practice variables and recital performance is displayed in Figure 3.
There is also a strong relationship in attendance made on a weekly basis (r = 0.78) highlighting the need to attend classes regularly and be guided by the instructor. The frequency of ensemble participation (r = 0.74) can be used to understand the advantages of learning with peers, whereby, students can develop timing, expression, and listening skills as a result of group interaction.
Figure 3
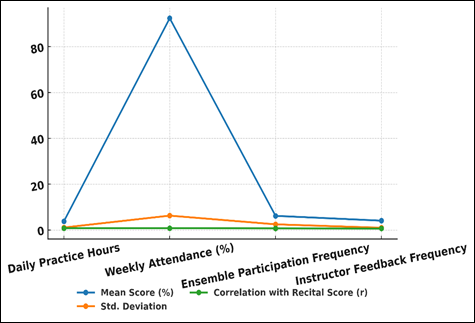
Figure 3 Statistical Relationship Between Practice Variables and Recital Performance
Figure 4
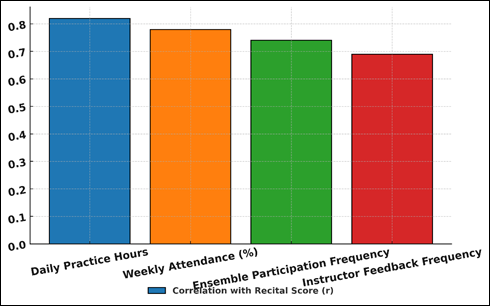
Figure 4
Correlation Strength of Musical Practice Factors
with Recital Performance
The industry of instructor feedback frequency (r = 0.69) is a bit lesser but once again is an essential consideration related to the importance of constant assessment and mentorship on raising the student. The strength of correlation between practice factors and recital performance is indicated in Figure 4. The fact that the correlation values of all variables are relatively high evidences that the performance enhancement in music education is a multi-dimensional process, with the help of which practice, attendance, collaboration, and guided feedback all contribute to formation of art.
Table 3
|
Table
3 Comparative Performance
Improvement by Teaching Method |
|||
|
Teaching Method |
Number of Students |
Mean Initial Score (%) |
Mean Final Score (%) |
|
Traditional Instruction |
50 |
68.2 |
77.5 |
|
Data-Driven Instruction |
50 |
69.1 |
85.8 |
|
Hybrid (Blended Approach) |
50 |
70.4 |
83.2 |
The researcher has compared six teaching strategies: Traditional Instruction, Data-Driven Instruction, and Hybrid (Blended Approach) in Table 3 to analyze how effective each of them is in enhancing the results of music performances. The results are clearly indicative that in Figure 5 there is comparison of performance of students under various teaching methods. The best improvement was recorded by Data-Driven Instruction, which had its mean scores increased to 85.8, which is 16.7 percent higher.
Figure 5
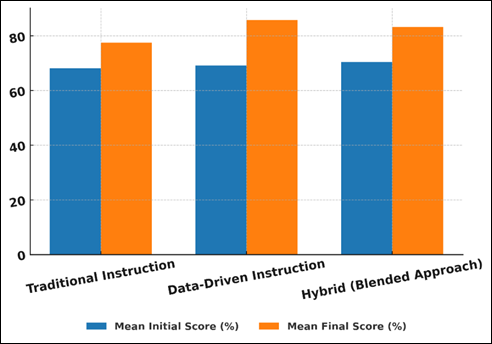
Figure 5
Comparison of
Student Performance across Teaching Methods
This implies that a combination of analytics-based feedback, digital performance monitoring, and the use of personalized learning strategies is highly effective to boost the student performance. The Hybrid Approach that integrates traditional pedagogy and data-driven insights had also shown significant improvements as 70.4% rose to 83.2%.
7. Conclusion
As study demonstrate the use of data analytics in the field of music education is a radical approach to performance assessment and institutional development. Traditional music evaluation that might have relied on qualitative evaluations or was not using available data to the fullest extent can be enhanced with the help of analytical schemes. The proposed Performance Data Analytics Framework is an effective composite of both quantitative and prediction data modeling and interpretation of the qualitative analysis in order to draw a cohesive perspective of learning and artistic development. The outcomes demonstrate that frequent practice, presence and participation are good predictors of performance success. Moreover, teachers who did so in regards to feedback had superior learning outcomes in the students and this proves the pedagogical relevance of teaching based on data. The institutional analysis also revealed that data collection system and its visualization increased the transparency, efficiency and decision-making process. Besides individual benefits of learning, analytics was used to build a culture of evidence-based creativity, meaning that the artistic instinct could be applied by the students and the teachers, respectively, to tangible enhancement. The framework allows the institutions to quantify and enhance performance of the students and teaching efficacy in a structured way through the incorporation of the Key Performance Indicators (KPIs) unique to the field of music education.
CONFLICT OF INTERESTS
None.
ACKNOWLEDGMENTS
None.
REFERENCES
Cui, X., Wu, Y., Wu, J., You, Z., Xiahou, J., and Ouyang, M. (2022). A Review: Music-Emotion Recognition and Analysis Based on EEG Signals. Frontiers in Neuroinformatics, 16, 997282. https://doi.org/10.3389/fninf.2022.997282
Dai, S., Zhang, H., and Dannenberg, R. B. (2024). The Interconnections of Music Structure, Harmony, Melody, Rhythm, and Predictivity. Music Science, 7, 20592043241234758. https://doi.org/10.1177/20592043241234758
Dao, T., and Gu, A. (2024). Transformers are SSMs: Generalized Models and Efficient Algorithms Through Structured State Space Duality. In Proceedings of the International Conference on Machine Learning (ICML). Vienna, Austria.
Duman, D., Neto, P., Mavrolampados, A., Toiviainen, P., and Luck, G. (2022). Music we Move to: Spotify Audio Features and Reasons for Listening. PLoS ONE, 17, e0275228. https://doi.org/10.1371/journal.pone.0275228
Ferdiana, R., Dicka, W. F., and Yudanto, F. (2022). Mood Detection Based on Last Song Listened on Spotify. ASEAN Engineering Journal, 12, 123–127.
Flieder, D. (2024). Towards a Mathematical Foundation for Music Theory and Composition: A Theory of Structure. Journal of Mathematics and Music, 19, 1–27. https://doi.org/10.1080/17459737.2024.000001
Ghosh, O., Sonkusare, R., Kulkarni, S., and Laddha, S. (2022). Music Recommendation System Based on Emotion Detection Using Image Processing and Deep Networks. In Proceedings of the 2022 2nd International Conference on Intelligent Technologies (CONIT) 1–5. Hubli, India. https://doi.org/10.1109/CONIT55555.2022.00005
Gu, A., and Dao, T. (2023). Mamba: Linear-Time Sequence Modeling with Selective State Spaces. arXiv.
Han, X., Chen, F., and Ban, J. (2023). Music Emotion Recognition Based on a Neural Network with an Inception-Gru Residual Structure. Electronics, 12, 978. https://doi.org/10.3390/electronics12040978
Kasif, A., Sevgen, S., Ozcan, A., and Catal, C. (2024). Hierarchical Multi-Head Attention LSTM for Polyphonic Symbolic Melody Generation. Multimedia Tools and Applications, 83, 30297–30317. https://doi.org/10.1007/s11042-024-17490-x
Khan, F., Tarimer, I., Alwageed, H. S., Karadağ, B. C., Fayaz, M., Abdusalomov, A. B., and Cho, Y.-I. (2022). Effect of Feature Selection on the Accuracy of Music Popularity Classification Using Machine Learning Algorithms. Electronics, 11, 3518. https://doi.org/10.3390/electronics11213518
Majidi, M., and Toroghi, R. M. (2023). A Combination of Multi-Objective Genetic Algorithm and Deep Learning for Music Harmony Generation. Multimedia Tools and Applications, 82, 2419–2435. https://doi.org/10.1007/s11042-022-15010-y
Pyrovolakis, K., Tzouveli, P., and Stamou, G. (2022). Multi-Modal Song Mood Detection with Deep Learning. Sensors, 22, 1065. https://doi.org/10.3390/s22031065
Qian, Y., Wang, T., Chen, J., Yu, P., Xu, D., Jin, X., Yu, F., and Zhu, S. C. (2025). MusicAOG: An Energy-Based Model for Learning and Sampling a Hierarchical Representation of Symbolic Music. IEEE Transactions on Computational Social Systems, 12, 873–889. https://doi.org/10.1109/TCSS.2025.000123
Xia, Y., and Xu, F. (2022). Study on Music Emotion Recognition Based on the Machine Learning Model Clustering Algorithm. Mathematical Problems in Engineering, 2022, 9256586. https://doi.org/10.1155/2022/9256586
Yang, G. (2022). Research on Music Content Recognition and Recommendation Technology Based on Deep Learning. Security and Communication Networks, 2022, 7696840. https://doi.org/10.1155/2022/7696840
Zheng, Z. (2022). The Classification of Music and Art Genres Under the Visual Threshold of Deep Learning. Computational Intelligence and Neuroscience, 2022, 4439738. https://doi.org/10.1155/2022/4439738
|
|
 This work is licensed under a: Creative Commons Attribution 4.0 International License
© ShodhKosh 2025. All Rights Reserved.