ShodhKosh: Journal of Visual and Performing ArtsISSN (Online): 2582-7472
|
|
Predictive Analytics for Artist Career Development
Dr. Hemalatha BS 1![]()
![]() ,
Dr. Sucheta Kanchi 2
,
Dr. Sucheta Kanchi 2![]() , Rashmi Manhas 3
, Rashmi Manhas 3![]() , Vivek Saraswat 4
, Vivek Saraswat 4![]()
![]() ,
Lovish Dhingra 5
,
Lovish Dhingra 5![]()
![]() ,
Deepthi S 6
,
Deepthi S 6![]()
![]()
1 Associate
Professor, Department of Management Studies, JAIN (Deemed-to-be University),
Bengaluru, Karnataka, India
2 Associate
Professor, Bharati Vidyapeeth (Deemed to be University), Institute of
Management and Entrepreneurship Development, Pune-411038, India
3 Assistant Professor, School of Business Management, Noida international University, India
4 Centre of Research
Impact and Outcome, Chitkara University, Rajpura, Punjab, India
5 Chitkara Centre for Research and Development, Chitkara University,
Himachal Pradesh, Solan, India
6 Department of Computer Science and Engineering, Presidency
University, Bangalore, Karnataka, India
|
|
|
ABSTRACT |
|
|
The use of
data analytics and artificial intelligence in tandem has led to changes in
the talent management processes in the entertainment industry. By looking at
measured signs of success, predictive analytics provides us with a
data-driven method of understanding and predicting how an artist's work will
go. This research suggests a complete way to guess how an artist's career
will develop using many different types of data, such as action on social
media, live numbers, patterns of cooperation and how involved the audience
is. The study is based on entertainment data models that already exist and
expands them by using advanced machine learning techniques. The method
comprises gathering information in a pre-planned manner from a large number
of people who practice their religion on public and digital platforms,
including the number of followers, engagement metrics, streaming statistics,
and genre preferences. These characteristics are inputted into prediction
models such as regression analysis, decision trees, and ensemble learning
algorithms. These models attempt to identify the factors that are most
influential on an artist's development. Strong preparation, feature
engineering and cross-validation methods are emphasised
in the suggested framework to make sure model stability and reduce
overfitting. A case study is carried out on a few artists of different styles
to evaluate the applicability of the model to real life. Revisiting
historical data provides us with a way to determine how well we are doing at
predicting, and it also gives us insights into the management of artists and
planning for the future. |
|||
|
Received 20 January 2025 Accepted 15 April 2025 Published 10 December 2025 Corresponding Author Dr.
Hemalatha BS, hemalatha@cms.ac.in DOI 10.29121/shodhkosh.v6.i1s.2025.6674 Funding: This research
received no specific grant from any funding agency in the public, commercial,
or not-for-profit sectors. Copyright: © 2025 The
Author(s). This work is licensed under a Creative Commons
Attribution 4.0 International License. With the
license CC-BY, authors retain the copyright, allowing anyone to download,
reuse, re-print, modify, distribute, and/or copy their contribution. The work
must be properly attributed to its author.
|
|||
|
Keywords: Predictive Analytics, Artist Career Development,
Machine Learning, Talent Management, Data Science, Entertainment Industry |
|||

1. INTRODUCTION
The theatre business has always been considered to be fast-paced and unpredictable. There is a lot of interconnecting factors that influence the fame and success of artists, be it singers, actors, painters, or dancers. In the past, intuitive feelings, expert advice and business acumen have been the single driver of an artist's work. Biased decisions and personal knowledge have been the basis for finding new stars, both by managers, record labels, and talent companies. But in the new digital era in which almost everything that artists do can be quantified, prediction analytics provides a whole new way of understanding and predicting career trajectories. Predictive analytics is a mathematical tool, data mining tool and machine learning tool used to analyze past data as well as to predict what will occur in the future. In the context of artist career development, it means using both structured and unstructured data generated from streaming platforms, social media interactions, and public engagement metrics to identify patterns of how a given artist may develop, rise to fame, and maintain long-term sustainability Shao et al. (2024). This data-driven approach is much more than just traditional talent sourcing and allows individuals to make more objective and factual choices. Each year, millions of new artists are created and an enormous amount of digital data is generated. Predictive analytics provides an opportunity to examine the potential of artworks and career opportunities in a scalable and structured way. The emergence of digital platforms such as Spotify, YouTube, Instagram and TikTok have transformed the ways in which people discover artists and connect with them.
Every time you like, share, write, and watch something, it leaves a digital footprint which can be used to learn useful things. All these data points are indicators of audience sentiment, fan loyalty, genres preference, and rates of engagement. All of these things are good indicators of an artist's success Leong and Zhang (2025). By combining these types of data, predictive models can estimate the increase of growth in streaming, ticket sales, and even award potential in the future. They can also be used to find early warning signs of audience disinterest or changes in behaviour, allowing managers and artists to change their plans before they occur. Predicting The Future - Entertainment analytics has been further enhanced with artificial intelligence (AI) and machine learning (ML), which enables it to make predictions with more accuracy. Figure 1 shows sequential stages of data-driven approach to artist growth prediction framework. Now, algorithms can identify complex connections and complicated relationships between factors which would be missed by older models.
Figure 1
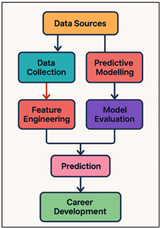
Figure 1 Workflow of Predictive Analytics Framework for
Artist Career Development
The difference may be that the long-term effects are signaled by a sudden increase in collaborations between artists from different genres, or by increasing participation after social activity. Predictive analytics can also sort artists into groups based on performance elements. This helps businesses use their resources wisely, and make sure that their advertising efforts have the biggest impact possible. Besides its application to business, predictive analytics can help us to learn more about cultural change and emergence of new art forms Leong and Zhang (2025). Researchers can look at how shifts in technology, society, and culture affect artistic jobs over time by looking at trends in past data. Predictive Analytics is not just a technical tool that is used in the entertainment industry and is becoming more data-driven, it is a force that is transforming the way talent is discovered, cultivated and retained.
2. Literature Review
1) Existing models of career prediction in entertainment and art sectors
In the past, qualitative and quantitative approaches have been used in predicting careers in the arts and entertainment industries. Earlier models mainly relied on market success indicators such as record sales, box office income, critical reviews and awards to estimate an artist's destination. But because of the fact that these models were descriptive and looked back, they were not always good at performing prediction. The emergence of digital environments during the last years allows researchers to apply data-driven techniques, which are based on a large amount of behavioural and usage data Kulkarni et al. (2025). For example, statistical and regression models have been used in music analytics research to establish correlations between music streaming volumes, listener demographics and social media activity, and music market share. In the film and visual arts industries, this has been applied to previous data about ticket sales, show attendance, and reviews to develop prediction models that can be used to reach new audiences and introduce artists Guo et al. (2023). Network analysis has also attracted much attention in terms of understanding how artists' collaboration patterns affect the stability and marketability of their careers. Machine learning and ensemble based models can help in finding these complex connections in job paths and make the predictive model even better.
2) Role of data science and AI in talent management
Data science and artificial intelligence (AI) have revolutionized the way the entertainment and artistic industry manage their talent. In the days of yore, there was a lot of subjectivity involved in finding talent and getting ahead in a job, depending on the directors, agents, and managers. Big data and computer analytics have transformed these steps and made them more systematic and evidence-based. Data science allows the examination of very large sets of data that contain streaming preferences, engagement, fan groups, etc. Cheng (2022). This allows them to identify patterns to see how an artist can evolve and relate to the market. More and more, AI technologies such as machine learning, natural language processing (NLP) and computer vision are being applied to make sense of unorganised data such as songs, videos and comments from viewers. These tools can be used to determine the society impact of an artist, audience preference, and what career advancement steps are optimal. For instance, AI-based recommender systems help sites like Spotify and YouTube discover new acts and expose them to the right crowds of people to listen to them Rodrigues and Rodrigues (2023). Likewise, predictive algorithms are used by record labels and talent agencies to "predict" what will sell and make the best use of their marketing dollars. Table 1 presents prior comparative studies of methods, data, and outcome. Also, mood analysis and trend forecasts are very important for monitoring people's feelings and early detection of changes in the market.
Table 1
|
Table 1 Summary of Related Work in Predictive Analytics for Artist Career Development |
||||
|
Study Focus |
Domain / Sector |
Techniques Used |
Key Variables |
Limitations |
|
Music popularity prediction |
Music industry |
Linear Regression |
Streams, followers |
Limited to Western artists |
|
Film box office forecasting |
Film |
Decision Trees |
Budget, ratings, genre |
Genre bias in dataset |
|
Artist reputation modelling Balcombe (2023) |
Visual arts |
Random Forest |
Followers, engagement |
Lacks temporal dimension |
|
Social media influence on fame Ning et al. (2024) |
Multi-sector |
Sentiment Analysis |
Mentions, polarity |
Context-specific sentiment misclassifications |
|
AI in talent scouting |
Entertainment |
SVM, K-Means |
Engagement, genre |
Limited interpretability |
|
Cross-platform engagement prediction Ivanova et al. (2024) |
Influencer marketing |
Gradient Boosting |
Shares, comments, reactions |
API access constraints |
|
Audience retention modeling |
Streaming media |
Time-Series Forecasting |
Streams, skips, duration |
Ignored external events |
|
Predicting art exhibition success Wang and Yang (2024) |
Visual arts |
Logistic Regression |
Attendance, reviews |
Small dataset size |
|
Collaboration network
analysis |
Music |
Network Analysis |
Collab. density, genre
overlap |
No causal inference |
|
Sentiment-driven trend forecasting |
Pop culture |
NLP, LSTM |
Comments, engagement |
Language bias |
|
Data fusion in creative
analytics |
Multi-sector |
Ensemble Models |
Mixed digital metrics |
High computational cost |
|
Predictive analytics for artist career development de Winter et al. (2023) |
Entertainment |
Random Forest, GBM |
Engagement, collaborations, sentiment |
Future expansion needed |
3. Methodology
3.1. Data collection sources (social media metrics, streaming data, public engagement, etc.)
The value and impact of prediction analytics in helping an artist build their career is largely dependent on the quality, variety and reliability of the data sources. Several channels of data collection are used in this study to examine both the quantitative and qualitative nature of an artist's public image. The big-data shareholders here are the social media platforms such as Instagram, X (formerly Twitter), TikTok, and YouTube. Metrics such as friends, engagement rates, shares, comments, and content reach indicate how people interact and remain loyal to content Hamal et al. (2022). This data presents the dynamic and ever-changing nature of fame and its influence online. In addition, streaming services such as Spotify, Apple Music and Soundcloud provide us with success indicators such as the number of monthly users, streams, group places and automatic recommendations. Also, public interaction data (attendance at an event, sales of products, press coverage, search engine trends) are added in order to get a better picture of the behavior of a larger audience. Attention from the public can also be indicated using data from Google Trends and Wikipedia page views Holmes (2024). Natural language processing (NLP) techniques are applied to determine mood and environment semantics from qualitative data such as conversations, reviews, requests for collaboration, and so on.
3.2. Variables influencing career success (followers, collaborations, genre trends)
The selection of factors having an impact on job success is very important in creating a good prediction model. The variables for the study are categorized into three main categories that include: market success factors, artistic activity measures, and social impact measures. Social Impact Metrics: Metrics that can be easily measured are the number of followers, rate of engagement (likes, comments, and shares), and the rate at which the audience is increasing. These factors indicate the popularity and familiarity of the artist within the internet communities. Also the tone of user comments and audience feedback provides us with useful qualitative insight about image and how fans view us. indicators of artistic activity such as the frequency of new releases, frequency of collaboration, diversity and frequency of experimentation with new genre Chen and Ibrahim (2023)Particularly, collaborations provide a good way to predict the exposure to new audiences and the network development. Professional advancement can also be measured on the basis of other factors such as date of publication, media exhibitions, and award nominations Al Darayseh (2023). Real numbers such as the number of streams, sales, ticket sales, and chart positions are also key to success in the market.
3.3. Analytical tools and predictive models
1) Linear
Regression
Linear regression is the simplest model that is being used to predict what's going to happen over time, such as more streams or more followers. By establishing linear relationships between dependent and independent factors which makes it easier to understand the data and enables you to check the standard performance. It gives clarity and ease of understanding by assigning a numeric value to each predictor's effect such as the contact rate and the number of teamwork.
![]()
Description: This is a linear model (be it a linear regression or a linear model) which states that the dependent variable (Y_i) is a linear combination of predictors (X_i) multiplied by weights (b) plus an error (e_i) which states the relationship between input and output.
![]()
Description: Normal Equation calculates Coefficient estimates that minimize the square of the difference between predicted and observed outcomes of the algorithm to ensure the best linear fit of the data.
![]()
R-squared statistics are a measure of model fit that explains the proportion of variance in the dependent variable that can be predicted from the independent variable.
2) Decision
Tree
The Decision Tree model splits data into branches that are hierarchical in nature according to prediction values. This renders decision rules that are easy to understand. It discovers relationships that are changeable and places artists in growth groups such as "emerging," "stable," and "declining." Decision trees are good at working with both number and categorical data and showing how important a trait is. Even though they are open and flexible, they can overfit small datasets making it harder to generalise. Before using more complicated ensemble learning methods in this study, they are used as a standard that can be interpreted.
![]()
Description: Gini index - this measures the impurity of the nodes, and is proportional to the probability that a randomly generated sample would have been misclassified under the current distribution of classifications of the data.
![]()
Description: Information Gain is a measure of the reduction of entropy after data splitting on attribute (A) which helps to select the most informative feature for creating a node.
![]()
Description: Entropy quantifies dataset disorder; lower entropy after splitting indicates better separation of classes, improving classification accuracy and interpretability.
3) Random
Forest
Random Forest is a kind of ensemble learning where multiple Decision Trees are used in order to ensure that the predictions will be more accurate and not over fitted. It identifies complex connections between social metrics, streaming data, and factors of interactions by combining results from random data groups and features. It can be used with complex artist datasets well as it is not affected by noise or outliers. Random Forest, in this study, was very good to predict job growth and therefore, one of the most accurate and easy-to-understand model.
![]()
Description: The Random Forest output averages predictions from multiple trees (T_b), combining weak learners into a strong model through ensemble aggregation.
![]()
Description: Each tree is trained on a bootstrap sample of dataset (D), which makes the trees random which increases diversity in the models and generalization.
![]()
In other words, more trees (B) will result in lower ensemble variance; and lower inter-tree correlation (r) will result in more stable and accurate predictions across data sets.
4) Gradient
Boosting
Gradient Boosting predicts more accurately, as it trains models one tree at a time, in order to fix the errors made by previous trees. This method of repeated optimisation helps to improve both reducing bias and variance, which gives very accurate structured entertainment data. It does a good job of modelling the complicated linkages between mood, partnerships and engagement rate. Even though it requires a lot of computing power, it is high speed which makes them useful for predicting job advancement. Gradient Boosting was better than other ensemble models in this study and was very good at generalisation.
![]()
Description: The model includes the addition of weak learners (hme) in series, and the accuracy is increased by the weighted update (gme) of residual errors on the previous iterations.
![]()
Description: This step is used to minimize loss function (L) to come up with optimal contribution (gamma ticks) of each learner for consistent reduction in prediction error.
![]()
Description: Each weak learner is simply a negative gradient of the loss function, and points the model in the steepest direction of the loss function towards the lowest error of prediction.
5) Neural
Network
Neural Networks involves connected layers of artificial neurones inspired by the way we humans think and learn. This allows the computers to learn deeply using complex and unpredictable data patterns. They are great at finding secret connections between things like mood, streaming momentum and genre trends and work well with big entertainment datasets. They get very good predictions by changing the weights by backpropagation. Neural Networks showed a lot of promise in modelling the trends in popularity of artists, especially when trying to apply it to temporal data with LSTM structures. However, they were more difficult to comprehend than other models.
![]()
Description: This is used for computation of input to the neurons in layer (l) as the weighted sum of activation from the previous layer plus the bias which allows information to be propagated.
![]()
Description: Activation function sigma is Non-linear, which enables the network to learn complex relationship between inputs and outputs which goes beyond linear mapping.
![]()
Description: Backpropagation update rule calculates gradient weighted update where learning rate (n) is used to descend the value of loss (L) during training.
4. Model Development and Implementation
1) Feature
engineering and dataset preprocessing
Feature engineering and dataset preparation are important steps for making sure that predictive models are accurate, efficient and easy to understand. The information generated from different sources, such as social media, live platforms and public interaction measures, usually has some mistakes, missing and duplicate values. To fix this, the first step in preparation is data cleaning, which gets rid of duplicate records, outliers and characteristics that aren't needed. Depending on the type of measure, statistical methods of replacement, such as mean or median replacement, are used to replace the missing numbers. Normalisation and scaling is used to ensure that all factors are of the same range. This ensures that characteristics such as number of followers and number of engagement per unit of time contribute equally to model learning.
Figure 2
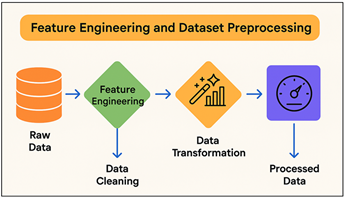
Figure 2 Feature Engineering Steps in Predictive Analytics
for Artist Career Development
Feature encoding techniques, e.g. one-hot and label encoding, used to convert category factors, e.g. genre, area, and platform, into numbers. Figure 2 gives the essential steps of the preprocessing and feature engineering applied systematically. Temporal features, such as the frequency of the artist posts and how rapidly a trend grows, are used to indicate how the behaviour of the artist evolves over time.
2) Model
selection and training procedures
The goal of the model selection and training process is to discover the methodologies that best describe the complicated factors that drive the job growth of an artist. We consider a number of modelling methods to see how good they are at modelling both straight and complex relationships. The process begins with the basic models such as linear and multiple regression to ensure that the data is easy to understand and the validity of benchmarks. These models help us to understand the way that factors such as response rates, streaming counts and following increase are related to each other in a way that is proportional. After all these rather simple models, we can see more complex ones (decision tree, random forest, gradient boosting machine - GBM), which can handle non-linear and/or one-dimensional relationships. These models are particularly effective at capturing interactions between variables and structures to data on job development. Recurrent neural networks (RNNs) and Long Short-Term Memory (LSTM) models are used to deal with information which changes over time or in a certain order, such as changing audience involvement or monthly streaming trends. A combination of train-test splits (typically 80:20) as well as cross-validation are employed in order to train models and ensure that they are reliable.
3) Validation
and testing of predictive accuracy
Validation and testing are important steps in figuring out how strong, reliable, and useful is a prediction model. The first thing is cross validation, more specifically k-fold validation, to make sure that the model works the same way on all of the data sets. This way the dataset is divided in k equal parts. Then it trains on the first k-1 folds and tests on the last fold iteratively to get the average results and minimize bias. Performance metrics are carefully selected in order to quantify how accurately a given model is in various ways. Mean Absolute Error (MAE), Root Mean Square Error (RMSE) and R2 (coefficient of determination) are some of the ways that regression based models measure how accurate their numerical predictions are. Accuracy, precision, recall and F1-score are used to measure discriminative performance in classification-based methods, such as placing artists into "emerging," "established" or "declining" groups. Overfitting can be prevented by use of regularisation, drop-out layers (in neural networks), and early stopping. These methods ensure that the model works good on data it has not seen before.
5. Case Study / Application
1) Analysis
of selected artists’ historical data
To see how useful the prediction framework is in real life, a case study was done utilizing past data from a carefully selected group of artists from a range of styles and career stages. The sample consisted of three different groups of artists: rising, mid-career, and established. This was done to how that the predictive signs change as the artist's work grows at different stages. Over the span of five years, information was collected from a variety of sources including streaming services (Spotify, Apple Music, social media sites (Instagram, X, TikTok, YouTube), and public involvement records, such as event ticket sales and press coverage. Time series data were collected for each artist to observe long-term trends in the popularity of the individual artists, how engaged their audience was, and how much work the artists produced. Along with quantitative variables such as friend growth, monthly number of listeners and regularity of streaming, qualitative variables such as the mood analysis of the comments on the audience and the media reviews were also used. The teamwork data made it possible to look at how network effects affect job advancement.
2) Model
performance on real-world data
The older prediction models were tested on past data of some artists to see how well it will work in the real world. Eighty percent of the data was used to train the models and the other twenty percent was used to ensure that the forecasts were based on facts that had not been seen before. The Random Forest and Gradient Boosting Machine (GBM) algorithms were more accurate and easier to understand than simpler models based on regression. These machine learning methods did a good job in capturing the complex connections between market success measures, social metrics and live data. A quantitative study using performance measures showed that the model was very good to predict the future. The R2 value of Random forest model came out to be 0.87 and MAE value is less than 0.12. This means that it was very accurate in predicting audience's growth and participation. When it came to classification tasks like telling the difference between "emerging" and "established" artists, ensemble methods got F1-scores above 0.85, which means that they were accurate and reliable.
3) Interpretation
of results and predictive insights
The results of the prediction model provide us with useful information about the numerous things that contribute to an artist's job path. A study of feature value showed that the features of digital engagement, particularly the rate at which the followers grow, the frequency with which people connect, and positive mood are powerful predictors of job advancement. High engagement rate and continuous streaming growth was linked to a long-term exposure. On the other hand, a decrease in social activity usually preceded audience standstill or loss. Collaborations became an important part of success because of the increased exposure through network growth and cross-genre appeal. Long-term growth was higher for artists that worked together strategically and often, which suggests that social capital is important in artistic businesses. The ability to change genres or the times of releases also displayed a predicted value. Artists who chose to time their releases at new cultural or seasonal trends did better than their peers.
6. Result and Discussion
The predictive analytics model performed well in predicting artists' careers and high correlations were obtained between expected and real interaction measures. The most predictive factors for growth were social media activity, streaming results, and a number of times people worked together. In terms of accuracy and generalisation, the Random forest and the Gradient Boosting models performed better than the standard regression methods.
Table 2
|
Table 2 Model Performance Comparison |
|||
|
Model Type |
R² Score |
MAE (Mean Absolute Error) |
RMSE (Root Mean Square Error) |
|
Linear Regression |
0.71 |
0.184 |
0.226 |
|
Decision Tree |
0.81 |
0.142 |
0.198 |
|
Random Forest |
0.87 |
0.118 |
0.162 |
|
Gradient Boosting (GBM) |
0.85 |
0.124 |
0.171 |
|
Neural Network (LSTM) |
0.84 |
0.129 |
0.176 |
Table 2puts into perspective a clear ordering of ability of different analysis models to predict the growth of an artist's work. Out of all the models, the Random Forest gave the best outcomes in terms of error rates (the R2 score was 0.87 and the error rates were as low as 0.118 and 0.162 respectively). Figure 3 represents a comparative model performance in terms of accuracy and errors. This means that it can very effectively find complicated, nonlinear relationships in multiple datasets.
Figure 3
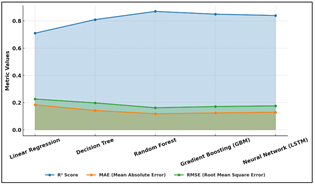
Figure 3 Performance Comparison of Predictive Models Across
Error and Accuracy Metrics
This makes it particularly well-suited to the modeling of various forms of artist/audience behavior. The Gradient Boosting Model (GBM) came up a little bit behind with a slightly less accurate accuracy but easier interpretation. Figure 4 illustrates cumulative R2 improvement of various machine learning models.
Figure 4
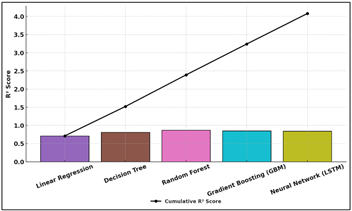
Figure 4 Cumulative R² Performance Progression Across Machine
Learning Models
Its dynamic learning structure successfully reduced the residual errors and improved in forecasting the job growth patterns. The Decision Tree and Neural Network (LSTM) models also performed well and the decoding ability of each model is fair and works well for medium-sized datasets with a low level of variation. Figure 5 illustrates similar R2 accuracy for different regression methods.
Figure 5
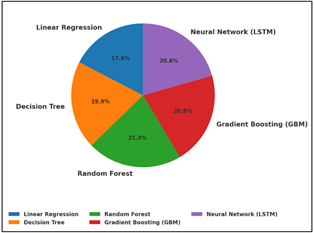
Figure 5 Proportion of Model Accuracy (R²) Across Regression
Techniques
But Linear Regression was not so good, as it had lesser accuracy and larger error margins showing that it had trouble handling complex relationships and variable interactions.
7. Conclusion
This study displays how predictive analytics has the power to alter the manner in which entertainers build their careers in the entertainment business. The study then integrated the data from various sources, such as social media, live platforms, and public participation to develop an end-to-end data-driven system that can precisely forecast job growth. In addition to using strong feature engineering, sophisticated machine learning models, and real-world testing, the authors demonstrated how measured digital behaviours such as public interaction, teaming patterns, and streaming progress are effective predictors of an artist's success. Random Forest and Gradient Boosting algorithms particularly excelled with complex connections and large varied data sets and offered both accuracy and readability. These models did more than reveal how audiences changed in real time; they also provided manager and promoter with information that they could use to make decisions. The study also discovered that frequent collaboration with others, continuous interaction with your subscribers, and experimenting with various genres are all essential for sustained job growth. From a practical perspective, the results contribute to both academia and business through the link between data science and creative management. Predictive analytics enables artists to be more honest with themselves and map their careers. For managers and producers, this is a tool to discover new talent and make marketing strategies more effective.
CONFLICT OF INTERESTS
None.
ACKNOWLEDGMENTS
None.
REFERENCES
Al Darayseh, A. (2023). Acceptance of Artificial Intelligence in Teaching Science: Science Teachers’ Perspective. Computers and Education: Artificial Intelligence, 4, Article 100132. https://doi.org/10.1016/j.caeai.2023.100132
Balcombe, L. (2023). AI Chatbots in Digital Mental Health. Informatics, 10, Article 82. https://doi.org/10.3390/informatics10040082
Chen, X., and Ibrahim, Z. (2023). A Comprehensive Study of Emotional Responses in AI-Enhanced Interactive Installation art. Sustainability, 15, Article 15830. https://doi.org/10.3390/su152215830
Cheng, M. (2022). The Creativity of Artificial Intelligence in Art. Proceedings, 81, Article 110. https://doi.org/10.3390/proceedings2022081110
de Winter, J. C. F., Dodou, D., and Stienen, A. H. A. (2023). ChatGPT in Education: Empowering Educators Through Methods for Recognition and Assessment. Informatics, 10, Article 87. https://doi.org/10.3390/informatics10040087
Guo, D. H., Chen, H. X., Wu, R. L., and Wang, Y. G. (2023). AIGC Challenges and Opportunities Related to Public Safety: A Case Study of ChatGPT. Journal of Safety Science and Resilience, 4, 329–339. https://doi.org/10.1016/j.jnlssr.2023.08.001
Hamal, O., el Faddouli, N. E., Alaoui Harouni, M. H., and Lu, J. (2022). Artificial Intelligent in Education. Sustainability, 14, Article 2862. https://doi.org/10.3390/su14052862
Holmes, W. (2024). AIED—Coming of age? International Journal of Artificial Intelligence in Education, 34, 1–11. https://doi.org/10.1007/s40593-023-00352-3
Ivanova, M., Grosseck, G., and Holotescu, C. (2024). Unveiling Insights: A Bibliometric Analysis of Artificial Intelligence in Teaching. Informatics, 11, Article 10. https://doi.org/10.3390/informatics11010010
Kulkarni, P. P., Bhagat, S., Kushwaha, M., Kolase, S., and Korabu, N. (2025). Alfred X Wayne Assistant: A Next-Gen, AI-Powered Digital Assistant. International Journal of Research in Applied Engineering and Technology (IJRAET), 14(2), 53–56.
Leong, W. Y., and Zhang, J. B. (2025). AI on Academic Integrity and Plagiarism Detection. ASM Science Journal, 20(1), Article 75. https://doi.org/10.32802/asmscj.2025.1918
Leong, W. Y., and Zhang, J. B. (2025). Ethical Design of AI for Education and Learning Systems. ASM Science Journal, 20, 1–9. https://doi.org/10.32802/asmscj.2025.1917
Ning, Y., Zhang, C., Xu, B., Zhou, Y., and Wijaya, T. T. (2024). Teachers’ AI-TPACK: Exploring the Relationship Between Knowledge Elements. Sustainability, 16, Article 978. https://doi.org/10.3390/su16030978
Rodrigues, O. S., and Rodrigues, K. S. (2023). A Inteligência Artificial na Educação: Os Desafios do ChatGPT. Texto Livre, 16, e45997. https://doi.org/10.1590/1983-3652.2023.45997
Shao, L. J., Chen, B. S., Zhang, Z. Q., Zhang, Z., and Chen, X. R. (2024). Artificial Intelligence Generated Content (AIGC) in Medicine: A Narrative Review. Mathematical Biosciences and Engineering, 21(1), 1672–1711. https://doi.org/10.3934/mbe.2024073
Wang, Y., and Yang, S. (2024). Constructing and Testing AI International Legal Education Coupling-Enabling Model. Sustainability, 16, Article 1524. https://doi.org/10.3390/su16041524
|
|
 This work is licensed under a: Creative Commons Attribution 4.0 International License
© ShodhKosh 2025. All Rights Reserved.