ShodhKosh: Journal of Visual and Performing ArtsISSN (Online): 2582-7472
|
|
ASSESSMENT OF PUBLIC SPACE QUALITY OF DISTRICT CENTERS IN DELHI USING GOOD PUBLIC SPACE INDEX
Simranpreet Kaur 1![]()
![]() ,
Pankaj Chhabra 2
,
Pankaj Chhabra 2![]()
![]()
1 Research
Scholar, Department of Architecture, Guru Nanak Dev University, Amritsar,
Punjab, India
2 Assistant
Professor, Department of Architecture, Guru Nanak Dev University, Amritsar,
Punjab, India
|
|
|
ABSTRACT |
|
|
Public Spaces
are a representative image of a city and play a vital role in maintaining social quotient of its people. Social interactions are a
part of human nature for healthy and happy
lifestyle. These interactions can happen with anybody and everybody varying
from person to person. District centers are a typology of public spaces
conceived in a master plan as part of mandatory commercial quotient in a
neighborhood. In Delhi, these district centers are fundamental for public
gatherings as they possess active and passive commercial spaces, retail,
offices, food outlets and much more. This research paper aims to examine the
qualitative aspects of these district centers with respect to good public
space index (GPSI) given by researcher Vikas Mehta via primary surveys and
public interaction. The study is a part of bigger research problem of
evaluating publicness of Indian public spaces. It covers key attributes of a
public space and people’s perception of it, followed by recommendations to
enhance the value of urban public spaces. |
|||
|
Received 07 May 2023 Accepted 14 July 2023 Published 19 July 2023 Corresponding Author Simranpreet
Kaur, ar.simranpreet@gmail.com DOI 10.29121/shodhkosh.v4.i2.2023.450 Funding: This research
received no specific grant from any funding agency in the public, commercial,
or not-for-profit sectors. Copyright: © 2023 The
Author(s). This work is licensed under a Creative Commons
Attribution 4.0 International License. With the
license CC-BY, authors retain the copyright, allowing anyone to download,
reuse, re-print, modify, distribute, and/or copy their contribution. The work
must be properly attributed to its author.
|
|||
|
Keywords: Quality Assessment, Good Public Space, District
Centers, Delhi |
|||


1. INTRODUCTION
Cities
are a mix of multiple utilities that help human in
maneuvering through them, earning the living, recreating, and finally
living in a peaceful neighborhood. Density of population and land use trigger
the intensity of transportation network required in that area. This in turn
defines the built space characteristics and the web of public activities
subsequently involved. Humans are social animals. Social interactions at
various levels are a basic human necessity, be it brother to brother
interaction, husband to wife interaction, father to child interaction, or even
grandfather to his old friend talking about life and spirituality. An
individual interacts at various levels. In the book, “The Great Good Place” Oldenburg (1989) Sociologist Ray Oldenburg defines
such places where we socialize, interact, spend quality time, and build social
relationships as “Third places”. The quality of interaction and time span is dependent
on various factors, the companion, ambience of the place, quality of amenities
available there like food, drinks, toilets, etc., location of the place along
with others. Stangor (2004)
In
broader terms, human interactions happen at various levels; private, inner
circle or public. These domestic and social interactions require a good quality
space to occur. Carmona (2008). Urban public spaces need to be sufficient enough to cater safe
social interactions for its users, especially post-Covid 2020 scenario. These
spaces are made of some basic elements together creating a built environment.
The most essential element of all is ease of accessibility Carmona (2008). More
comfortable, safe, and easy the access is, it attracts more activities
generating social integration. The factors influencing accessibility of a
public space are; its physical design, vehicular
traffic in the vicinity, environmental quality, aesthetic value of the space,
and space for multiple activities and age groups (like interacting with
acquaintances, walking, maneuvering and other forms of social interaction).
Therefore, it is important that these public spaces emanate the best balance of
all these elements to ensure the good quality public spaces in a city. Disproportionate ratio of any element may lead to
underutilized space or even disturb the surroundings (e.g.
traffic jams). As per Jan Gehl, the presence of these elements indicates
quality urban public spaces in a city. Gehl (2010)
2. LITERATURE
2.1. DISTRICT CENTRE
The Wikipedia explanation of ‘District Centre’ incorporates a large assortment of spaces within the city. A large coterie of shops, clubbed with well-defined and quantified retail and non-retail facilities that collectively acts as a shopping complex is called as District Centre. The retail portion in a District Centre mostly emphasizes on food outlets, convenience goods, essential services in a neighborhood, and a broad range of goods’ outlets. Conventionally, they are harbored/ bound by at least one superstore or supermarket. Non-retail commercial facilities mostly include banks, restaurants, cafes, launderettes, health care facilities, public library, and place of worship, offices, theatre, leisure facilities and buildings for community use Mathew Carmona (2003). It is not necessary that all the aforementioned amenities should be available, but a mix of uses as per user demand, area and population concentrations.
Delhi is an Indian city with exorbitant built characteristics, commonly categorized from Category A to H on the basis of level of amenities in the area. As per Master plan of Delhi 2021, a District Center is designed to serve 5 lakh populations whereas a community center serves about 1 lakh population in the neighborhood. This categorization is governed by the five-tier system of commercial areas of MPD 2021. These DC’s and CCs are owned by Delhi Development Authority, the supreme development authority in Delhi NCR. They can either lease out the individual shops or the whole the whole unit depending upon the type of contract Tibbalds (2001). These district centers are a mix of active and passive commercial space, including government and private offices, retail shops, formal and informal vendors and food outlets. Parking, paved plaza, corridors, and other amenities are a part of the conceived layout plans. The footfall varies from location to location dependent on multiple other factors of public interaction Sauter (2008).
Aim of this research were to understand the qualitative aspect of public space in these District centers and to assess the relation of physical built environment to the quality of space generated. This research paper attempts to uncoil the people’s needs in public spaces and its relation with built environment and surroundings Schmidt (2007). Taking Gehl’s theory as base, it is assumed that the presence of outdoor activities indicate a good quality public space and helps in generating social interaction within people Gehl (2010). Therefore, the presence of such activities and events has been focused during primary surveys and observations. As per Masterplan of Delhi-2021, for every 5 lakh population, asdistrict centre is proposed. And Delhi has total 23 district centres spread across the city. District centres (DC) developed or in advanced stage sof development are: Nehru palce, Bikaji cama place, Managalam Place, Rajendra palce, janakpuri, Shivaji palce, Netaji subhash place, laxmi nagar, Saket,and jhandewalan. Other district centres in process of development are: Trans-Yamuna Area-Shahdara, Rohini-twin centre, Peeragarhi, Paschim vihar, Shalimar Bagh, Majnu ka Tila, Dilshad Garden, Dheerpur Extension, Mayur Vihar, Shastri park, Dwarka, Rohini-III, IV, V, and Narela. The analysis of all attributes is possible only in DC which are functional from long time, have high footfall and have gone through change with changing surroundings. Only Nehru Palce, Bikaji Cama, Rajendra Palce, Janakpuri, and Jhandewalan fulfill these conditions. Hence, any two out of these five could be studied further for the attributes.
2.2. GOOD PUBLIC SPACE INDEX (GPSI)
Quality public space augments a stage for diverse interactions, planned and unplanned meetings, public encounters, and meaningful discussions Siregar (2014). Public spaces that have ability to facilitate such social interactions have been characterized as essential counterpart to private lives by sociologist Ray Oldenburg Oldenburg (1989). This is considered essential to satisfy human need to relax, recreate and socialize in his regular home-office lifestyle.
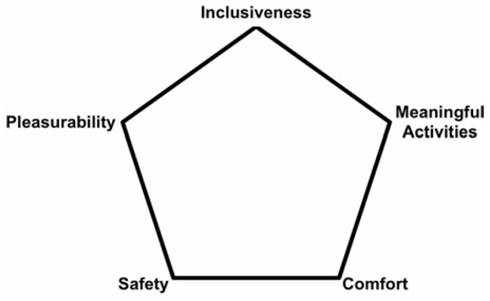
Vikas Mehta Mehta (2014) has defined a framework to evaluate public space. According to him, a good quality public space should be physically and visually accessible, safe, open, and meaningful in its activities and design. This shall impart comfort, convenience, sense of control, sense of safety and pleasure while using the space or thinking cognitively about it. (Refer Figure 1).
Figure 1
|
Figure 1 Dimensions of Public Space by Mehta (2007) |
These five dimensions have been further defined by Mehta (2007) into multiple sub-categories, where each sub-category is given certain weightage. These indices are together adjudged in a public space and a scoring is done.
3. METHODOLOGY
Mehta (2007) Good public Space Index method has been utilized in addition to data from user experience mapping, behavioral mapping, and primary surveys. The sub-categories of all components have been analyzed with observations and primary surveys. Author Vikas Mehta developed a toolkit for to measure performance of public spaces in Indian context. None of the other authors were found to have developed the toolkit with respect to Indian complexities and social strata. Therefore, the study has been purely based on evaluating publicness of District Centres on the basis of attributes defined by him in the most relatable format.
Methodology followed for the detailed study was majorly primary surveys and general interaction with end users. The collected data from only two case studies was evaluated in correlation with several build environment components. Scoring was done for both selected sites in form of questionnaires and author’s observations, during day and night on weekdays and weekends. Minimum 10 entries were taken for all times. Table 1 represents average rating for each attribute extracted from the answers received. The findings have been made a part of this research and respective recommendations have also been suggested in the conclusion.
The choice of two case studies selected for this research out of five possible locations has been made on the basis of availability of data and easy of conducting surveys. The sites are:
1) Nehru place,
2) BikajiCama Place
4. ANALYSIS
4.1. NEHRU PLACE
This District Centre was conceptualized in 1969, but came to functional stage in 1980s as a CBD (Commercial business district). Nehru place resides in the middle of residential neighbourhoods from all sides. This 38 hectares property located in the centre of South Delhi is accessible via both at grade vehicular route on two sides, 2 Delhi metro lines and 24 BRTS routes. The built area of this business district is approx. 5.8 lakh sqm, that’s less than 2/3rd of the total covered space. Nearly, 1,30,000 visitors and 32,000 vehicles visit this place on daily basis. The layout has one large courtyard in the middle, surrounded by four storied buildings on all sides. Underground parking below the courtyard space is usually full, and is supported by additional surface parking provisions by SDMC.
4.2. BIKAJI CAMA PLACE
Designed by renowned architect Raj Rewal, one of the initial buildings of this complex got constructed in 1973. This business district is designed and developed into multiple levels, which makes it less accessible and confusing. Most of the shops in the core areas are lying empty because of lack of visual accessibility. All towers have their independent basement parking provisions. Though the central courtyard portion was paved in 2005, the originally conceptualized Dholpur stone finishing on elevation is still embracing the aesthetics of the area. Spread across 16 hectares, this commercial center (CBD) has approximately 32% ground coverage with 4.6 lakh sqm. built commercial development. The buildings are mid-rise towers fringed around courtyards and large plazas.
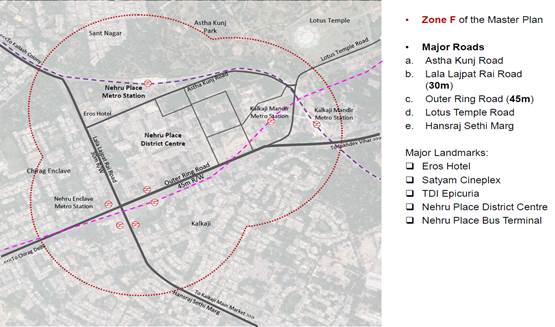
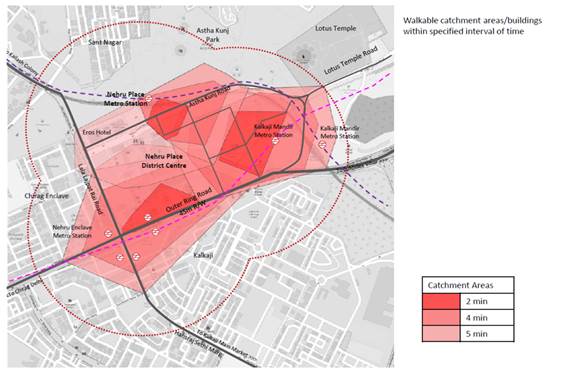
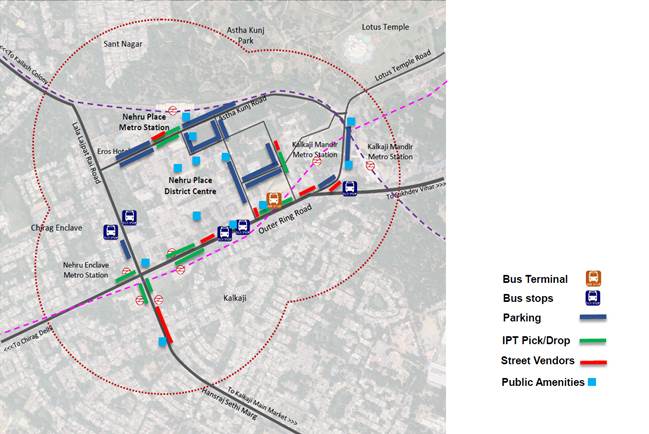
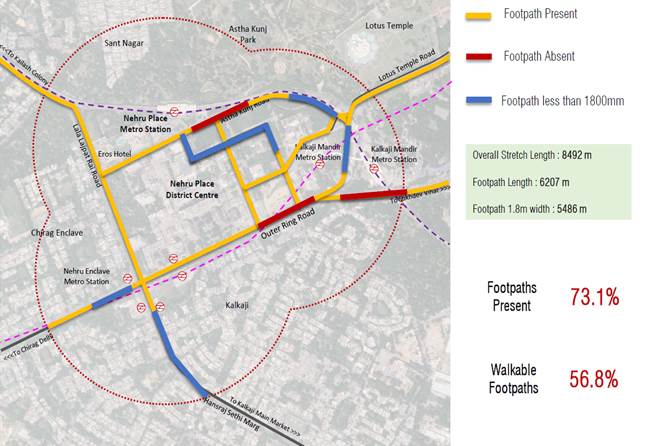
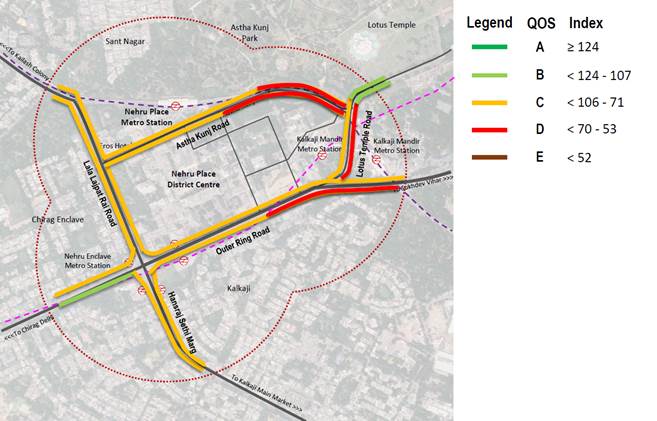
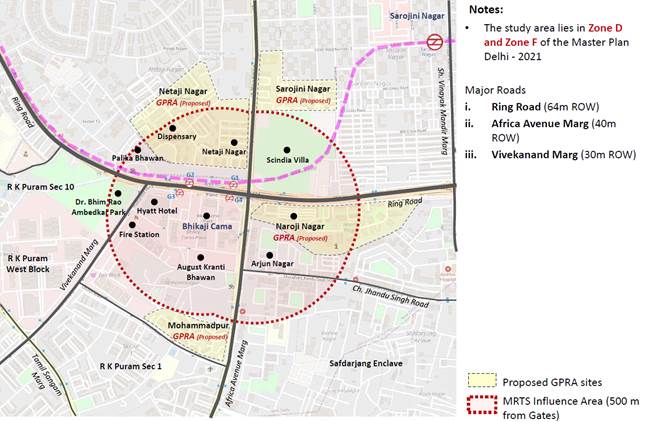
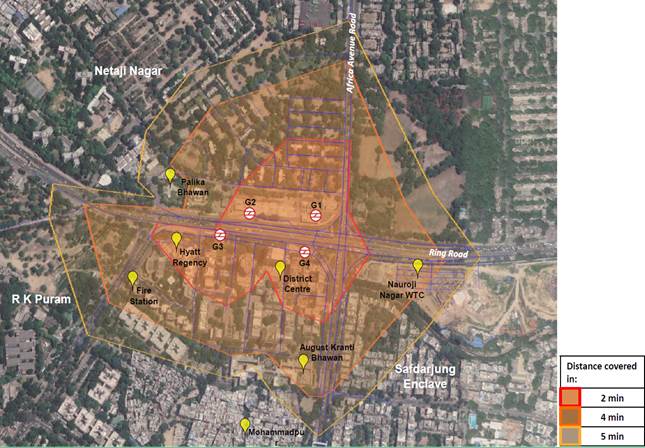
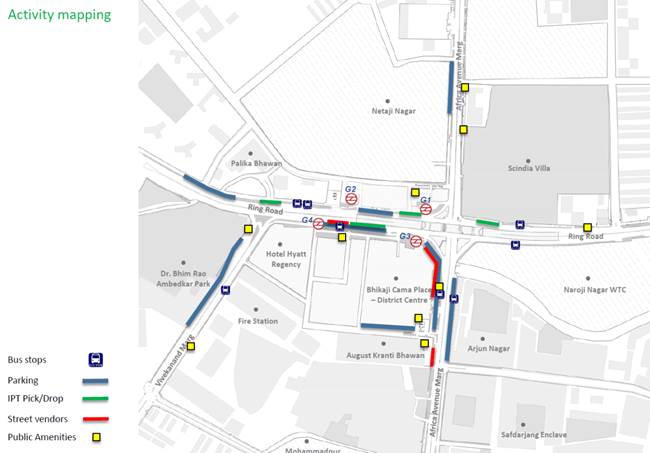
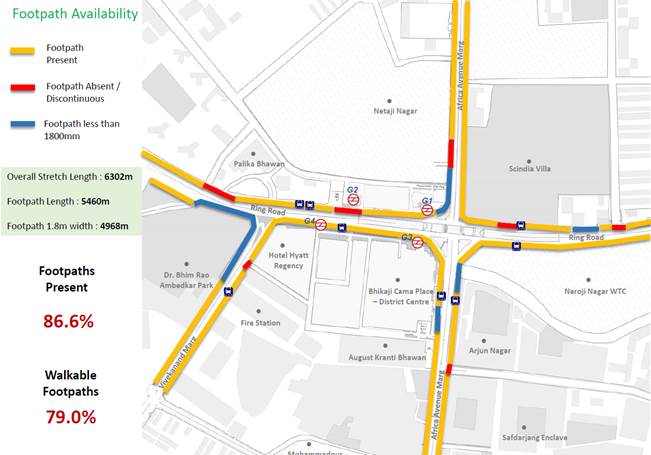
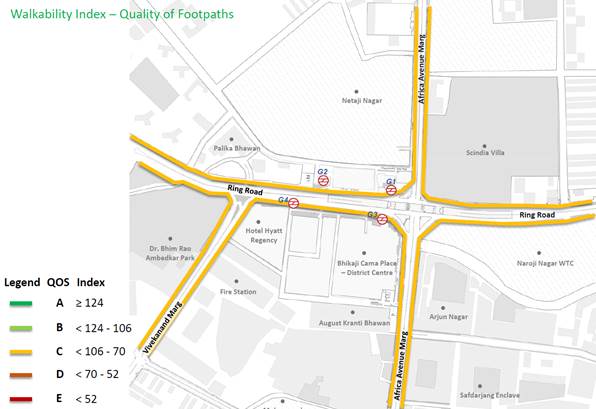
Figure 1, Figure 2, Figure 3, Figure 4, Figure 5, Figure 6, Figure 7, Figure 8, Figure 9, Figure 10, Figure 11, Figure 12 elaborate the urban design analysis done for both case studies in the form of maps. These maps explain; site context and surroundings, pedestrian analysis (ped-shed), activities happening, availability of footpath, walkability analysis and a few reference pictures in sequential order for both Nehru place and Bikaji Cama place.
Figure 2
|
Figure 2 Nehru Place Context Plan. Source UTTIPEC Report |
Figure 3
|
Figure 3 Nehru Place Ped-Shed Analysis. Source UTTIPEC report |
Figure 4
|
Figure 4 Nehru Place Activity Mapping. Source UTTIPEC Report |
Figure
5
|
Figure 5 Nehru Place Footpath Availability. Source UTTIPEC Report |
Figure 6
|
Figure 6 Nehru Place Walkability Index. Source UTTIPEC Report |
Figure 7
|
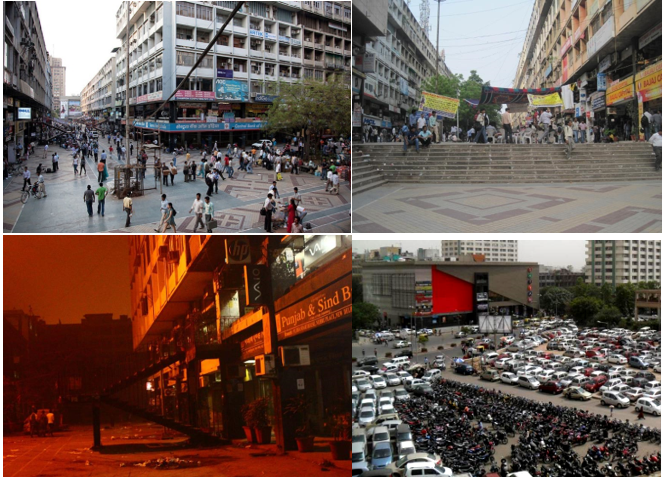
Figure 7 Images of Nehru Place |
Figure 8
|
Figure 8 BikajiCama Context Plan. Source UTTIPEC Report |
Figure 9
|
Figure 9 BikajiCamaPed-Shed
Analysis. Source UTTIPEC Report |
Figure 10
![]()
|
Figure 10 BikajiCama Activity
Mapping. Source UTTIPEC Report |
Figure 11
![]()
|
Figure 11 BikajiCama Footpath
Availability. Source UTTIPEC Report |
Figure ![]() 12
12
|
Figure 12 BikajiCama Walkability
Index. Source UTTIPEC Report |
Figure 13
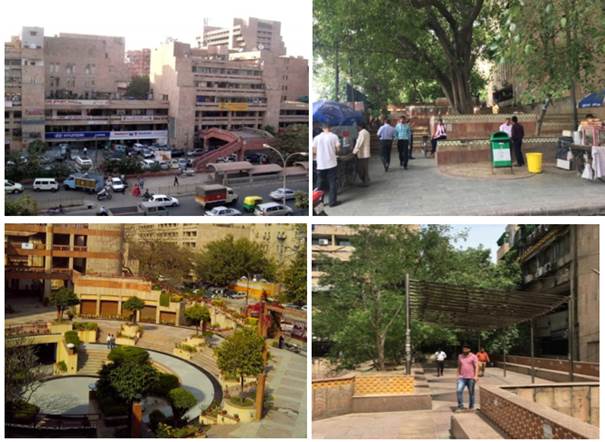
|
Figure 13 Images of BikajiCama Place |
|
5. FINDINGS AND DISCUSSION
Refer Table 1 below for detailed evaluation of attributes of public space as explained in Vikas Mehta’s Good Public Space Index (GPSI). The process of qualitative measurement generated two values for GPSI (Good Public Space Index), i.e. 2.3 and 2.1 respectively for Nehru Place and BikajiCama place. The highest indices are for inclusivity dimension and the lowest on safety (6/30) and comfort (5/30). These values indicate that design and maintenance component of any space is the most important factor for a good public space. Though both of these District centers receive immense footfall, because of presence of multiple and diverse utilities, but people enjoy the space when we provide them feeling of safety and comfort. This can be achieved via outdoor lighting enhancement, providing shaded walkways in huge existing plazas, and increasing accessibility at the edges Kaur and Chhabra (2022). It was observed during questionnaire session that people are fond of visiting Nehru place more than Bikaji Cama, owing to the availability of more food outlets, presence of vendors and retail shops. Bikaji Cama place is perceived as less accessible space, due to multiple factors, a) presence of flyover that creates visual barricading of the main entrance, b) too many levels within the plaza, c) vendors restricted to rear access only, and d) less retail and more office complexes. Presence of service lane all around the Bikaji Cama complex ensures better safety of pedestrians and even provides buffer for car parking queue. Whereas in case of Nehru Place, huge traffic chaos was observed along with unsafe pedestrian crossings and deficiency of parking space with respect to the footfall observed every day.
Table 1
|
Table
1 Evaluation of Selected Sites on
Vikas Mehta's GPSI Model |
|||||
|
Aspects of Public Space |
|
Variables |
Weightage |
Nehru Place Avg. |
Bikaji Cama Place Avg. |
|
Inclusiveness |
1 |
Presence of
people of diverse ages |
0.4 |
3 |
2 |
|
|
2 |
Presence of
people of diff. genders |
0.4 |
2 |
2 |
|
|
3 |
Presence of
people of diverse classes |
0.4 |
3 |
2 |
|
|
4 |
Presence of
people with diverse physical abilities |
0.4 |
1 |
1 |
|
|
5 |
Presence of
people of diverse race |
0.4 |
1 |
1 |
|
|
6 |
Control of
entrance, gates, fences, etc. |
1.0 |
3 |
2 |
|
|
7 |
Range of
activities and behaviors |
1.0 |
3 |
2 |
|
|
8 |
Opening hours of
public space |
1.0 |
3 |
2 |
|
|
9 |
Presence of
signs to exclude certain people or behaviors |
1.0 |
3 |
3 |
|
|
10 |
Presence of
surveillance and security cameras |
1.0 |
2 |
2 |
|
|
11 |
Perceived
openness and accessibility |
2.0 |
1 |
1 |
|
|
12 |
Activity
engagement |
1.0 |
1 |
2 |
|
Total |
10 |
26/30 |
22/30 |
||
|
Meaningful Activities |
13 |
Presence of
community places |
2.0 |
3 |
3 |
|
|
14 |
Range of
activities and behaviors |
1.0 |
3 |
2 |
|
|
15 |
Space flexibility
to adapt user needs |
1.0 |
2 |
1 |
|
|
16 |
Availability of
food within and at edges |
2.0 |
3 |
2 |
|
|
17 |
Variety of
businesses at edges |
1.0 |
3 |
1 |
|
|
18 |
Suitability of
space layout to activity and behavior |
2.0 |
2 |
1 |
|
|
19 |
Usefulness of
businesses and other uses |
1.0 |
2 |
1 |
|
Total |
10 |
18/30 |
11/30 |
||
|
Comfort |
20 |
Free of cost
sitting places |
2.0 |
1 |
2 |
|
|
21 |
Seating provided
by businesses |
1.0 |
1 |
1 |
|
|
22 |
Presence of
other furniture and artifacts |
1.0 |
1 |
1 |
|
|
23 |
Climatic comfort
of space/ shelter |
2.0 |
0 |
0 |
|
|
24 |
Design elements discouraging
use of space |
1.0 |
1 |
0 |
|
|
25 |
Perceived
Physical condition and maintenance |
2.0 |
1 |
1 |
|
|
26 |
Nuisance noise
from traffic and others |
1.0 |
0 |
1 |
|
Total |
10 |
5/30 |
6/30 |
||
|
Safety |
27 |
Visual and
physical connection and openness to adjacent spaces |
1.0 |
1 |
0 |
|
|
28 |
Physical
condition and maintenance |
1.0 |
1 |
2 |
|
|
29 |
Lighting quality
in space after dark |
1.0 |
1 |
0 |
|
|
30 |
Perceived safety
from presence of cameras, guards, fences, etc. |
1.0 |
2 |
1 |
|
|
31 |
Perceived safety
from crime during daytime |
2.0 |
2 |
2 |
|
|
32 |
Perceived safety
from crime after dark |
2.0 |
0 |
0 |
|
|
33 |
Perceived safety
from traffic |
2.0 |
0 |
1 |
|
Total |
10 |
7/30 |
6/30 |
||
|
Pleasurability for plaza, street, etc. |
34 |
Presence of
memorable landscapes (imageability) |
1.0 |
1 |
3 |
|
|
35 |
Sense of
enclosure |
1.0 |
1 |
2 |
|
|
36 |
Permeability of
building facades on street front |
1.0 |
1 |
1 |
|
|
37 |
Personalization
of buildings on street front |
1.0 |
2 |
2 |
|
|
38 |
Articulation in
architectural features on street front |
1.0 |
1 |
3 |
|
|
39 |
Density of
elements on sidewalk providing sensory complexity |
1.0 |
3 |
2 |
|
|
40 |
Variety of elements
on sidewalk |
1.0 |
2 |
2 |
|
|
41 |
Perceived
attractiveness of space |
2.0 |
1 |
3 |
|
|
42 |
Perceived
interestingness of space |
1.0 |
2 |
2 |
|
Total |
10 |
14/30 |
20/30 |
||
|
Grand Total |
71/150 |
65/150 |
|||
|
Note: All variables have been measured on
weekdays and weekends with minimum ten observations spread throughout the
day. The ratings are a part of primary surveys, questionnaire/ interview and author’s subjective observations. |
|||||
6. CONCLUSION
Following conclusions summarize the research:
· GPSI (Good public space index) is a comprehensive index for measuring quality of public spaces in context to spaces for outdoor activities.
· Safety and comfort are the most important factors behind the success and quality of a space. Any kind of lag in them can de-popularize the space Andi Muhammad Ichsan Djainuddina (2019).
· Vehicular traffic and good public environment are inversely proportional to each other. More the traffic, less conducive environment it generates, and lesser the traffic, more footfall is attracted to create ambient public space Kaur and Chhabra (2022).
· Maintenance of the space is one major factor influencing the footfall and attractiveness of an outdoor public space. Clean and hygienic spaces that support pedestrian activities are psychologically more attractive and render conducive environment.
The above stated conclusions can be treated as general specifications for success of a quality outdoor public space. These conclusions augment tour research to following recommendations for a good public space:
· A specific methodology needs to be developed for measuring qualitative aspect of a public space. Sole dependence on observations can lead to much subjective results and may blemish the objectivity of the research. A more elaborated social science methodology with detailed valuation of built environment quality is suggested.
· Privatization within public space needs to be redressed at macro and micro level. Policy level implications and design guidelines need to be issued for paid and unpaid services within public spaces. The old theoretical frameworks distinctively segregating public and private scenarios need modifications from 21st century usage pattern.
· GPSI by Vikas Mehta is a virtuous tool for measurement of quality of outdoor public spaces, except that it lacks the components of urban level aesthetics and sense of place. A more comprehensive method in measuring qualitative components of outdoor public spaces is suggested.
CONFLICT OF INTERESTS
None.
ACKNOWLEDGMENTS
I acknowledge UTTIPEC for sharing their urban analysis reports for Bikaji Cama Place and Nehru Place. These reports helped me as base maps for further analyzing the good public space indices on these district centers.
REFERENCES
Andi Muhammad Ichsan Djainuddina, A. H.
(2019). The Visitors’ Perception Toward the Comfort
of Social Interaction in Public Space. EPI International Journal of
Engineering, 2, 149-156. https://doi.org/10.25042/epi-ije.082019.10.
Gehl, J. (2010). Cities for People.
Washington, Covelo, London : Island Press.
M. Carmona, S. M. (2008). Public
Space: The Management Dimension. London and New York: Routledge, Taylor and
Francis Group. https://doi.org/10.4324/9780203927229.
Mathew Carmona, T. h. (2003). Public Places, Urban Spaces: Dimensions of Urban Design. London : Architectural Press.
Mehta, V. (2007). A Toolkit for
Performance Measures of Public Space.
43rd ISOCARP Congress.
Mehta, V. (2014). Evaluating Public Sapce. Journal of Urban
Design, 53-88. https://doi.org/10.1080/13574809.2013.854698.
Oldenburg, R. (1989). The Great Good
Place. New York, US : Da Capo Press.
Sauter,
H. (2008). Liveable Streets and Social Inclusion. Urban Design
International, 67-69. https://doi.org/10.1057/udi.2008.15.
Schmidt, J. N. (2007). Toward a Methodology
for measuring security and publicly accessible spaces. Journal of the American
Planning Association, 73. https://doi.org/10.1080/01944360708977978.
Kaur, S., and Chhabra, P. (2022). Applicability of the Star
Model on Indian Neighborhood: Case of Malviya Nagar, South Delhi. ECS
Transactions, 107(1), 11017–11028. https://doi.org/10.1149/10701.11017ecst.
Siregar, J. P. (2014). Assessment Of Public
Space Quality Using Good Public. Procedia - Social and Behavioral Sciences,
10-17. https://doi.org/10.1016/j.sbspro.2014.07.318.
Stangor, C. (2004). Social Groups in Action
and Interaction. New York: Psychology Press. https://doi.org/10.4324/9780203338667.
Tibbalds, F. (2001). Making People Friendly Towns. London and New York : Spon Press.
|
|
 This work is licensed under a: Creative Commons Attribution 4.0 International License
© ShodhKosh 2023. All Rights Reserved.