ShodhKosh: Journal of Visual and Performing ArtsISSN (Online): 2582-7472
|
|
A COMPARATIVE ANALYSIS OF WORKING SCHEDULE CASTE WOMEN AND OTHER WOMEN OF HARYANA ON THE BASIS OF LITERACY RATE
Mona Kumari 1![]() , Dr. Satish Kumar 2
, Dr. Satish Kumar 2![]()
1 Research
Scholar, Department of Economics, Indira Gandhi University, Meerpur, Rewari
Haryana, India
2 Assistant
Professor, Department of Economics, Indira Gandhi University, Meerpur, Rewari
Haryana, India
|
|
|
ABSTRACT |
|
|
This paper
represents the comparison between Scheduled Caste working Women and other
Women of Haryana on the basis of literacy rate. The study is based on
secondary data compiled from the Census of Haryana 2011. This paper in
descriptive in nature. Data is processed with simple statistical techniques
such as percentages and correlation. Correlation is calculated between
literacy ratio and working population for SC Women and other Women
populations. A comparison is also made to see if the literacy ratio and working
population correlation exists for other Women and SC Women of Haryana. It is
found in the study that there is a correlation between literacy rate and the
working population of Women in Haryana. Fatehabad, Hisar, Sirsa, Jind and
Bhiwani are the districts of Haryana where high percentage of Scheduled Caste
Women are working whereas in Yamunanagar, Ambala, Nuh, Faridabad, Palwal less
percentage of Scheduled Caste Women are working. If we see overall percentage
working population of Women it is more in Bhiwani, Hisar, Jind, Mahendergarh,
Rewari while it is low in Yamunanagar, Ambala, Faridabad, Nuh, Palwal.
Surprisingly, percentage of working population for Scheduled Castes and
overall, for women are high in Bhiwani, Jind and Hisar districts and low in
Yamunanagar, Ambala, Faridabad, Nuh, Palwal districts of Haryana. In the last
section of this paper, it is highlighted that by considering this fact that
there is some relationship between literacy rate and percentage of working
population, Government may formulate policies in consonance with this factor
which is one of the important determinants of employment in our country. |
|||
|
Corresponding Author Mona
Kumari, monakumari27111983@gmail.com DOI 10.29121/shodhkosh.v5.i1.2024.1672 Funding: This research
received no specific grant from any funding agency in the public, commercial,
or not-for-profit sectors. Copyright: © 2024 The
Author(s). This work is licensed under a Creative Commons
Attribution 4.0 International License. With the
license CC-BY, authors retain the copyright, allowing anyone to download,
reuse, re-print, modify, distribute, and/or copy their contribution. The work
must be properly attributed to its author.
|
|||
|
Keywords: Scheduled Caste, Literacy Ratio, Working Population,
Correlation |
|||


1. INTRODUCTION
Literacy is the ability that enables one to read, write, and speak in order to communicate effectively and meaningfully. Literacy is a vital element required for the development of a country. Literacy is a key indicator and a critical determinant for the development of a nation. For example, Finland, which is a Nordic country, is the most literate nation in the world and is counted among the top-developed countries. Lack of Literacy keeps a person back at every stage of life. People with low literacy levels are not able to read, write, speak, or understand books, newspapers, prices mentioned in articles, signatures, any agreements or other documents, the time-table of trains or buses, fill out any form, read instructions anywhere or using the internet, which is very important in the present day. Every country must provide its citizens with equal opportunities to get an education so that the people of that country can become a resource rather than a liability. Data on Literacy and unemployment shows that most developed countries with high literacy levels have large working populations and vice versa, and so is also true in the case of India.
India is a developing country struggling through the impediments of development, viz., low level of literacy, poverty, high level of unemployment, inflation and many more. A low level of literacy never lets India proceed on the path of development by leaps and bounds and results in high unemployment. Literate people not only can understand and analyse things accurately but also contribute to the development of their countries by becoming a part of the working population and adding to the productivity and hence enhancing GDP.
2. Objective of the study
The objective of this research paper is to study if there is any correlation between the literacy rate and the working population of Scheduled Caste women in Haryana and compare the same with the overall Women population of Haryana.
3. Methodology
Secondary data has been gathered from various sources like statistical abstracts of Haryana, various research papers, the census of India, the internet etc. Comparisons have been made using charts and tables to study the relationship between literacy level and work participation of Scheduled Caste women in different sector; Pearson’s correlation is calculated using the following formula: -
In order to test the significance of the correlation coefficient the following null (Ho) and alternative (H1) hypotheses are considered.

Where r is the population correlation co-efficient between two variables.
The appropriate test statistic to test the above hypothesis is
The values of the test statistic are given in Table in result section.
4. Results and Discussion
To compare the literacy level of SC women in Haryana with the overall Women literacy level, the data on literacy level is tabulated and presented through bar diagrams below. The percentage of literate SC Women and overall Women is worked out with abstract figures.
Table 1
|
Table 1 District Wise Literacy Rate of Women Population in Haryana |
||||||
|
Women literacy (SC) |
SC Women literacy (in %) |
Over all Women population |
Overall Women literacy |
Overall Women literacy (in %) |
||
|
Ambala |
1,39,372 |
54,139 |
38.84 |
5,29,647 |
3,56,737 |
67.35 |
|
Bhiwani |
1,59,687 |
59,890 |
37.50 |
7,67,773 |
4,26,713 |
55.57 |
|
Faridabad |
1,04,304 |
16,073 |
15.40 |
8,43,623 |
5,37,799 |
63.74 |
|
Fatehabad |
1,35,246 |
44,247 |
32.71 |
4,46,651 |
2,30,107 |
51.51 |
|
Gurugram |
93,605 |
23,918 |
25.55 |
6,97,742 |
4,72,450 |
67.71 |
|
Hisar |
1,91,447 |
60,152 |
31.41 |
8,12,369 |
4,44,111 |
54.66 |
|
Jhajjar |
79,592 |
32,311 |
40.59 |
4,43,738 |
2,76,611 |
62.33 |
|
Jind |
1,31,411 |
45,633 |
34.72 |
6,21,146 |
3,30,709 |
53.24 |
|
Kaithal |
1,16,027 |
38,712 |
33.36 |
5,03,301 |
2,60,747 |
51.80 |
|
Karnal |
1,59,923 |
56,238 |
35.16 |
7,07,612 |
4,13,497 |
58.43 |
|
Kurukshetra |
1,01,817 |
40,869 |
40.13 |
4,53,679 |
2,76,065 |
60.85 |
|
Mahendergarh |
73,894 |
33,358 |
45.14 |
4,35,423 |
2,49,815 |
57.37 |
|
Nuh |
35,508 |
11,893 |
33.49 |
5,18,101 |
1,46,462 |
28.26 |
|
Palwal |
95,382 |
28,834 |
30.23 |
4,88,211 |
2,20,100 |
45.08 |
|
Panchkula |
47,962 |
13,343 |
27.81 |
2,61,614 |
1,75,456 |
67.06 |
|
Panipat |
96,518 |
28,994 |
30.03 |
5,58,580 |
3,22,463 |
57.72 |
|
Rewari |
87,035 |
35,941 |
41.29 |
4,25,997 |
2,61,494 |
61.38 |
|
Rohtak |
1,01,316 |
31,198 |
30.79 |
4,92,725 |
3,11,557 |
63.23 |
|
Sirsa |
1,84,951 |
58,001 |
31.36 |
6,12,607 |
3,25,929 |
53.20 |
|
Sonipat |
1,25,419 |
44,594 |
35.55 |
6,68,702 |
4,08,435 |
61.07 |
|
Yamunanagar |
1,43,543 |
61,290 |
42.69 |
5,67,487 |
3,57,664 |
63.02 |
|
Total |
24,03,959 |
8,19,628 |
34.09 |
1,18,56,728 |
68,04,921 |
57.39 |
|
Source Compiled from Directorate of Census Operations,
Haryana.2011 |
||||||
Note: The main worker is one who has worked for 183 days or more in a year in one or more than one economic activity. A person who has worked for less than 183 days in a year is considered a marginal worker.
Chart 1
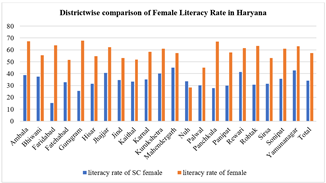
The total population, Literacy level and literacy level in percentage are shown in Table 1 for Scheduled Caste Women and overall Women for all districts of Haryana. It is clear from the table that more percentage of Scheduled Caste Women are literate in Mahendergarh, Yamunanagar Rewari, Jhajjar, and Kurukshetra districts of Haryana. In contrast, less percentage of Scheduled Caste Women are literate in Faridabad, Gurugram, Panchkula, Panipat and Palwal districts. The overall percentage of literacy of Women is higher in Gurugram, Ambala, Panchkula, Faridabad, and Rohtak, while it is low in Nuh, Palwal, Kaithal, Jind, and Hisar. It can be analysed from here that for those districts where as percentage of literacy level is low for Scheduled Caste Women, the overall percentage of literacy level is high and vice-versa.
A comparison is shown with the help of the above bar chart between the percentage literacy level of Scheduled Caste Women and overall Women in various districts of Haryana. The difference in percent literacy level is clear from the chart; in every district, the percentage of Women Scheduled Caste literacy is far less than the percentage overall Women literacy. In Faridabad district, the difference in percentage literacy level is maximum between Scheduled Caste Women and overall Women, whereas this difference is minimum in Mahendergarh district.
Table 2
|
Table 2 District Wise Working population of Women in Haryana |
||||||
|
Districts |
SC Women population |
SC Women working population |
SC Women working population (in %) |
Overall Women population |
Overall Women working population |
Overall Women working population (in %) |
|
|
-1 |
-2 |
-3 |
-4 |
-5 |
-6 |
|
Ambala |
1,39,372 |
14,440 |
10.36 |
5,29,647 |
52,019 |
9.82 |
|
Bhiwani |
1,59,687 |
36,279 |
22.71 |
7,67,773 |
1,92,328 |
25.05 |
|
Faridabad |
1,04,304 |
12,607 |
12.08 |
8,43,623 |
1,02,296 |
12.12 |
|
Fatehabad |
1,35,246 |
34,217 |
25.29 |
4,46,651 |
1,05,585 |
23.63 |
|
Gurugram |
93,605 |
12,200 |
13.03 |
6,97,742 |
1,12,260 |
16.08 |
|
Hisar |
1,91,447 |
48,282 |
25.21 |
8,12,369 |
2,03,300 |
25.02 |
|
Jhajjar |
79,592 |
12,185 |
15.30 |
4,43,738 |
76,514 |
17.24 |
|
Jind |
1,31,411 |
31,328 |
23.83 |
6,21,146 |
1,55,145 |
24.97 |
|
Kaithal |
1,16,027 |
23,779 |
20.49 |
5,03,301 |
81,203 |
16.13 |
|
Karnal |
1,59,923 |
30,700 |
19.19 |
7,07,612 |
1,04,416 |
14.75 |
|
Kurukshetra |
1,01,817 |
21,014 |
20.63 |
4,53,679 |
68,224 |
15.03 |
|
Mahendergarh |
73,894 |
13,897 |
18.80 |
4,35,423 |
1,05,649 |
24.26 |
|
Nuh |
35,508 |
4,234 |
11.92 |
5,18,101 |
65,322 |
12.60 |
|
Palwal |
95,382 |
12,232 |
12.82 |
4,88,211 |
68,099 |
13.94 |
|
Panchkula |
47,962 |
8,397 |
17.50 |
2,61,614 |
46,614 |
17.81 |
|
Panipat |
96,518 |
16,922 |
17.53 |
5,58,580 |
83,651 |
14.97 |
|
Rewari |
87,035 |
17,151 |
19.70 |
4,25,997 |
1,02,401 |
24.03 |
|
Rohtak |
1,01,316 |
13,096 |
12.92 |
4,92,725 |
73,321 |
14.88 |
|
Sirsa |
1,84,951 |
45,610 |
24.66 |
6,12,607 |
1,32,541 |
21.63 |
|
Sonipat |
1,25,419 |
25,303 |
20.17 |
6,68,702 |
1,32,094 |
19.75 |
|
Yamunanagar |
1,43,543 |
12,715 |
8.857 |
5,67,487 |
46,890 |
8.262 |
|
Total |
24,03,959 |
4,46,588 |
18.57 |
1,18,56,728 |
21,09,872 |
17.79 |
|
Source Compiled from Directorate of Census Operations,
Haryana. 2011 |
||||||
Chart 2
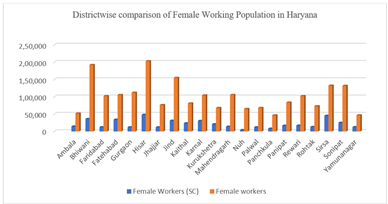
Total population, working population and working population in percentage is shown in the table no. 2 for Scheduled Caste Women and overall Women for all districts of Haryana. It is clear from the table that more percentage of Scheduled Caste Women are working in Fatehabad, Hisar, Sirsa, Jind and Bhiwani districts of Haryana whereas less percentage of Scheduled Caste Women are working in Yamunanagar, Ambala, Nuh, Faridabad, Palwal districts. If we see overall percentage working population of Women it is more in Bhiwani, Hisar, Jind, Mahendergarh, Rewari while it is low in Yamunanagar, Ambala, Faridabad, Nuh, Palwal. Surprisingly, percentage of working population for Scheduled Castes and overall for Women are high in Bhiwani, Jind and Hisar districts and low in Yamunanagar, Ambala, Faridabad, Nuh, Palwal districts of Haryana.
A comparison is shown with the help of the above bar chart between the percentage working population of Scheduled Caste Women and the overall working population of Women in various districts of Haryana. The difference in the percentage of the working population is clear from the chart; in every district, the percentage of the Women Scheduled Caste working population is far less than that of the overall Women working population. In Faridabad district, the difference in percentage literacy level is maximum between Scheduled Caste Women and overall Women, whereas this difference is minimum in Mahendergarh district.
Table 3
|
Table 3 District Wise Classification of SC Women Working Population |
||||||||
|
District |
Cultivator |
Agricultural Labour |
Household industry |
Other worker |
Main worker |
Marginal Workers |
Total workers |
Non-Workers |
|
|
(1) |
(2) |
(3) |
(4) |
(5) =1+2+3+4 |
(6) |
(7) =5+6 |
(8) |
|
Ambala |
319 |
2,130 |
295 |
6,290 |
9,034 |
5,406 |
14,440 |
1,24,932 |
|
Bhiwani |
2,390 |
6,096 |
295 |
5,237 |
14,018 |
22,261 |
36,279 |
1,23,408 |
|
Faridabad |
223 |
694 |
413 |
6,669 |
7,999 |
4,608 |
12,607 |
91,697 |
|
Fatehabad |
1,649 |
8,052 |
274 |
5,604 |
15,579 |
18,638 |
34,217 |
1,01,029 |
|
Gurgaon |
201 |
985 |
333 |
6,048 |
7,567 |
4,633 |
12,200 |
81,405 |
|
Hisar |
2,382 |
12,520 |
540 |
7,778 |
23,220 |
25,062 |
48,282 |
1,43,165 |
|
Jhajjar |
420 |
1,622 |
111 |
3,252 |
5,405 |
6,780 |
12,185 |
67,407 |
|
Jind |
1,028 |
7,051 |
238 |
4,938 |
13,255 |
18,073 |
31,328 |
1,00,083 |
|
Kaithal |
367 |
4,558 |
373 |
4,143 |
9,441 |
14,338 |
23,779 |
92,248 |
|
Karnal |
804 |
6,726 |
434 |
6,739 |
14,703 |
15,997 |
30,700 |
1,29,223 |
|
Kurukshetra |
201 |
5,573 |
231 |
5,707 |
11,712 |
9,302 |
21,014 |
80,803 |
|
Mahendragarh |
350 |
745 |
76 |
2,689 |
3,860 |
10,037 |
13,897 |
59,997 |
|
Nuh |
159 |
309 |
70 |
1,201 |
1,739 |
2,495 |
4,234 |
31,274 |
|
Palwal |
506 |
1,538 |
141 |
2,626 |
4,811 |
7,421 |
12,232 |
83,150 |
|
Panchkula |
295 |
556 |
200 |
5,034 |
6,085 |
2,312 |
8,397 |
39,565 |
|
Panipat |
319 |
2,351 |
456 |
6,568 |
9,694 |
7,228 |
16,922 |
79,596 |
|
Rewari |
349 |
1,005 |
310 |
5,194 |
6,858 |
10,293 |
17,151 |
69,884 |
|
Rohtak |
369 |
1,960 |
228 |
5,188 |
7,745 |
5,351 |
13,096 |
88,220 |
|
Sirsa |
2,227 |
12,027 |
492 |
6,925 |
21,671 |
23,939 |
45,610 |
1,39,341 |
|
Sonipat |
469 |
4,894 |
301 |
6,159 |
11,823 |
13,480 |
25,303 |
1,00,116 |
|
Yamunanagar |
259 |
1,944 |
357 |
4,903 |
7,463 |
5,252 |
12,715 |
1,30,828 |
|
Total |
15,286 |
83,336 |
6,168 |
1,08,892 |
2,13,682 |
2,32,906 |
4,46,588 |
19,57,371 |
|
Source Compiled from Directorate of Census Operations,
Haryana. 2011 |
||||||||
Note: The main worker is one who has worked for 183 days or more in a year in one or more than one economic activity. A person who has worked for less than 183 days in a year is considered a marginal worker.
The above table shows the distribution of scheduled caste Women working population among various categories. This distribution is presented here to understand the nature of the working population of scheduled caste Women, and the data of non-workers is also presented in the table. From this table, with the help of a bar chart, we can analyse that the maximum Women scheduled caste workers are agricultural workers in Hisar, Sirsa, Fatehabad, Jind and Karnal.
Chart 3
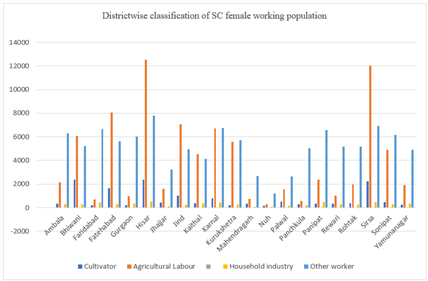
This chart presents the district-wise classification of the Scheduled Caste Women working population divided into various categories like cultivator, agricultural labour, household workers and other workers. The chart clearly shows that in Hisar and Sirsa, most of the workers are engaged in agricultural work as labour. The share of Agricultural labour and other workers is maximum in all districts of Haryana.
Table 4
|
Table 4 District Wise Classification of Overall Women Working Population in Haryana |
|||||
|
District |
Cultivator |
Agricultural Labour |
Household Industry |
Other Workers |
Total=Main +Marginal |
|
|
-1 |
-2 |
-3 |
-4 |
-5 |
|
Ambala |
3,457 |
7,701 |
2,810 |
38,051 |
52,019 |
|
Bhiwani |
1,04,093 |
37,451 |
5,700 |
45,084 |
1,92,328 |
|
Faridabad |
4,872 |
7,281 |
6,736 |
83,407 |
1,02,296 |
|
Fatehabad |
40,192 |
34,903 |
2,325 |
28,165 |
1,05,585 |
|
Gurgaon |
14,204 |
7,984 |
4,464 |
85,608 |
1,12,260 |
|
Hisar |
95,335 |
54,330 |
4,310 |
49,325 |
2,03,300 |
|
Jhajjar |
31,098 |
13,669 |
2,638 |
29,109 |
76,514 |
|
Jind |
79,677 |
38,806 |
2,743 |
33,919 |
1,55,145 |
|
Kaithal |
23,672 |
26,789 |
3,068 |
27,674 |
81,203 |
|
Karnal |
15,785 |
38,166 |
4,155 |
46,310 |
1,04,416 |
|
Kurukshetra |
5,442 |
26,002 |
2,119 |
34,661 |
68,224 |
|
Mahendragarh |
60,638 |
16,977 |
2,509 |
25,525 |
1,05,649 |
|
Nuh |
27,218 |
19,018 |
2,182 |
16,904 |
65,322 |
|
Palwal |
21,655 |
21,794 |
2,258 |
22,392 |
68,099 |
|
Panchkula |
7,397 |
2,852 |
2,806 |
33,559 |
46,614 |
|
Panipat |
14,382 |
17,952 |
4,596 |
46,721 |
83,651 |
|
Rewari |
36,492 |
12,619 |
4,396 |
48,894 |
1,02,401 |
|
Rohtak |
22,819 |
9,963 |
2,973 |
37,566 |
73,321 |
|
Sirsa |
40,826 |
49,227 |
4,030 |
38,458 |
1,32,541 |
|
Sonipat |
39,233 |
34,814 |
6,482 |
51,565 |
1,32,094 |
|
Yamunanagar |
3,192 |
8,594 |
2,447 |
32,657 |
46,890 |
|
Total |
6,91,679 |
4,86,892 |
75,747 |
8,55,554 |
21,09,872 |
|
Source Compiled from Directorate of Census Operations,
Haryana. 2011 |
|||||
Note: The main worker is one who has worked for 183 days or more in a year in one or more than one economic activity. A person who has worked for less than 183 days in a year is considered a marginal worker.
The above table shows the overall Women working population distribution among various categories. This distribution is presented here to understand the nature of the working population of overall Women. From this table, with the help of a bar chart, we can analyse that in Bhiwani, Fatehabad, Hisar, Jind, and Mahendergarh maximum Women workers are cultivators.
The chart below presents the district-wise classification of the overall Women working population divided into various categories like cultivator, agricultural labour, household workers and other workers. The chart clearly shows that in Palwal and Sirsa, most Women workers are household workers. The share of cultivators and other workers is maximum in almost all districts of Haryana.
Chart 4
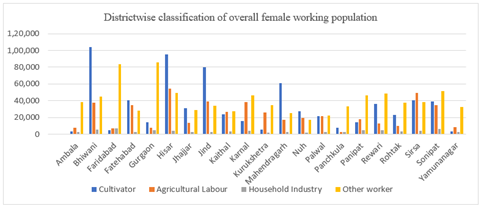
Table 5
|
Table 5 Correlation between Literacy Rate and Women Working Population |
||||
|
Districts |
Literacy rate of overall Women |
Working population of overall Women |
Literacy rate of SC Women |
Working population of SC Women |
|
-1 |
-2 |
-3 |
-4 |
|
|
Ambala |
3,56,737 |
52,019 |
54,139 |
14,440 |
|
Bhiwani |
4,26,713 |
1,92,328 |
59,890 |
36,279 |
|
Faridabad |
5,37,799 |
1,02,296 |
16,073 |
12,607 |
|
Fatehabad |
2,30,107 |
1,05,585 |
44,247 |
34,217 |
|
Gurgaon |
4,72,450 |
1,12,260 |
23,918 |
12,200 |
|
Hisar |
4,44,111 |
2,03,300 |
60,152 |
48,282 |
|
Jhajjar |
2,76,611 |
76,514 |
32,311 |
12,185 |
|
Jind |
3,30,709 |
1,55,145 |
45,633 |
31,328 |
|
Kaithal |
2,60,747 |
81,203 |
38,712 |
23,779 |
|
Karnal |
4,13,497 |
1,04,416 |
56,238 |
30,700 |
|
Kurukshetra |
2,76,065 |
68,224 |
40,869 |
21,014 |
|
Mahendragarh |
2,49,815 |
1,05,649 |
33,358 |
13,897 |
|
Nuh |
1,46,462 |
65,322 |
11,893 |
4,234 |
|
Palwal |
2,20,100 |
68,099 |
28,834 |
12,232 |
|
Panchkula |
1,75,456 |
46,614 |
13,343 |
8,397 |
|
Panipat |
3,22,463 |
83,651 |
28,994 |
16,922 |
|
Rewari |
2,61,494 |
1,02,401 |
35,941 |
17,151 |
|
Rohtak |
3,11,557 |
73,321 |
31,198 |
13,096 |
|
Sirsa |
3,25,929 |
1,32,541 |
58,001 |
45,610 |
|
Sonipat |
4,08,435 |
1,32,094 |
44,594 |
25,303 |
|
Yamunanagar |
3,57,664 |
46,890 |
61,290 |
12,715 |
|
Total |
68,04,921 |
21,09,872 |
8,19,628 |
4,46,588 |
|
Source: Compiled from Directorate of Census Operations,
Haryana. 2011 |
||||
Chart 6
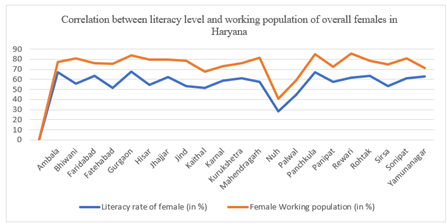
Chart 7
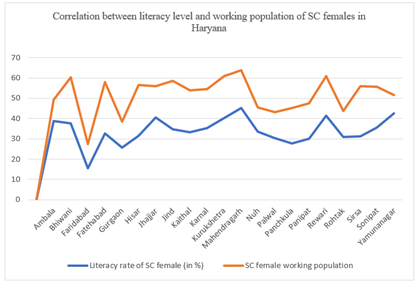
Table 6
|
Table 6 Correlation Matrix for Literacy rate and working population of Women in Haryana |
||
|
Literacy Rate |
Literacy Rate (SC) |
|
|
Working population |
.516 |
---- |
|
Working Population
(SC) |
---- |
.738 |
In order to know if there is any correlation between literacy rate and the working population in various districts of Haryana, a coefficient of correlation is obtained for both the sets of data, i.e. for the Scheduled caste Women population and the overall Women population.
The table represents the correlation coefficient value between two variables, i.e. Literacy rate and Working population of SC Women and overall Women in Haryana.
Table 7
|
Table 7 Test Statistic for Testing the Significance of Correlation Coefficient |
||
|
Relation between |
R |
t-ratio |
|
Literacy Rate and Working population |
.516 |
9.371 |
|
Literacy Rate and Working Population (SC) |
.738 |
4.108 |
The results of the test shows that there exists significant positive relationship between Literacy Rate and Working population of Scheduled caste Women and there is also a positive correlation between Literacy rate and working population of over all Women in all districts of Haryana.
5. Conclusion
From the above analysis, it is clear that there is a strong positive correlation between the literacy rate of SC women and their working population in all districts of Haryana. There is also a positive correlation between the literacy rate and the working population of overall Women in Haryana. It may be concluded from here that as women get literate, they get employment; however, education is not the only factor responsible for getting employment, but it may prove one of the significant factors that may bring some improvement in employment and economic conditions of women especially SC women in Haryana. Further, the government should take more solid steps and dedicated efforts to make SC women literate and educated to get employment and improve their status.
CONFLICT OF INTERESTS
None.
ACKNOWLEDGMENTS
None.
REFERENCES
Directorate of
Census Operations Haryana
Kak, S. (1994).
Rural Women and Labour Force Participation. Social Scientist, 22(3/4), 35–59.
Narayan, Laxmi.
(2016). Women's Labour Force Participation in Haryana : A Disaggregated
Analysis. 2.
|
|
 This work is licensed under a: Creative Commons Attribution 4.0 International License
© ShodhKosh 2024. All Rights Reserved.