ShodhKosh: Journal of Visual and Performing ArtsISSN (Online): 2582-7472
|
|
Revisiting of Measurement of Financial Inclusion of Rural Dominated States of India: Using CRISIL Inclusix Methodology
Rayees Ahmad Hajam 1![]() ,
Dr. Abdul Azeez N. P. 2
,
Dr. Abdul Azeez N. P. 2![]() ,
Mudasir Rajab 1
,
Mudasir Rajab 1![]()
![]()
1 Research
Scholar, AMU, Aligarh, India
2 Assistant
Professor, AMU, Aligarh, India
|
|
|
ABSTRACT |
|
|
The purpose of
the paper is to measure the level of financial inclusion across
rural-dominated states of India and to find the reasons for the low financial
inclusion scores. The CRISIL Inclusix methodology was employed using
secondary data for all dimensions of financial inclusion. All the dimensions
of financial inclusion were calculated separately to create a financial
inclusion index for each state separately. The financial inclusion index
ranges from 0 to 1 after the normalisation process. As 0 represents no
financial inclusion, and 1 represents complete financial inclusion. Himachal
Pradesh obtained the maximum score of 94.2 and was put in the high category,
while Meghalaya received the lowest score of 16.84 and was placed in the low
category. The remaining selected states, Arunachal Pradesh, Jharkhand, Uttar
Pradesh, and Chhattisgarh, obtained scores of 32.8, 26.76, 26.72, and 22.68,
respectively, placing them in the low category. |
|||
|
Corresponding Author Mudasir
Rajab, marcoathokpam@gmail.com DOI 10.29121/shodhkosh.v5.i1.2024.1655 Funding: This research
received no specific grant from any funding agency in the public, commercial,
or not-for-profit sectors. Copyright: © 2024 The
Author(s). This work is licensed under a Creative Commons
Attribution 4.0 International License. With the
license CC-BY, authors retain the copyright, allowing anyone to download,
reuse, re-print, modify, distribute, and/or copy their contribution. The work
must be properly attributed to its author.
|
|||
|
Keywords: CRISIL Inclusix, Financial Inclusion, Index of
Financial Inclusion, Branch Dimension, Credit Dimension |
|||


1. INTRODUCTION
Encouraging
social development, poverty reduction, and economic prosperity all depend on
financial inclusion. It allows people to engage in the formal economy, save
money safely, and obtain credit for emergencies or investments. It also
empowers people by giving them the tools to manage their money and make future
plans more effectively. Basically, financial inclusion is often considered to
be a crucial factor in helping nations to achieve a number of Sustainable
Development Goals (SDGs), especially in terms of eliminating poverty and
fostering shared economic growth (Burgess and Pande, 2005; Beck et al. 2007;
Beck et al. 2009). Greenwood and Jovanovic (1990) believe that barring
the impoverished from the financial system is unlikely to promote shared
economic progress since it will almost certainly exacerbate income inequality.
Leyshon and
Thrift (1995) coined the phrase "financial inclusion," which was
later defined by Coppcock, S. (2013) as "those processes that serve to
refrain present certain social groups and individuals from gaining access to
the formal financial system." Although they concentrate on financial
services accessibility, the United Nations (2006) defined financial inclusion
as the prompt provision of financial services to underserved segments of
society, hence stimulating the prompt provision of financial services. The term
explains why the underprivileged segments of the economy are enclosed and kept
out of the mainstream of financial services, but over time, it has come to
encompass all the elements necessary for an economy to grow.
The World Bank
(2006) emphasises in its report that the lack of price or non-price obstacles
in the use of financial services is the basic concept of financial inclusion.
It emphasises that small businesses and people worldwide shouldn't have to pay
exorbitant fees to get funding. To determine the risk factor for disbursing
cash, the customer's creditworthiness is crucial. The distinction between
"access to" and "use of" financial services is emphasised
for policy implications. The latter is dependent on supply and demand, whereas
the former is determined by supply. The research also emphasises how crucial
financial inclusion is to preventing mass involuntary exclusion. The group that
is excluded from financial services while needing them because the services are
not readily available.
These days, the buzzword of the day is financial inclusion. It is now the most significant word in the economics language. Globally, many members of the intelligentsia, including economists, policymakers, bankers, and academics, have expressed interest in it. Additionally, it has sparked a strong interest in the development circles. Global policymakers and central bankers convene in various venues to deliberate on the topic of ‘Financial Inclusion’ and build an economic framework that is more equitable regarding financial access. It is commonly considered a policy priority that must be addressed right away to create growth that is both fair and sustainable. As a result, it is now the subject of heated intellectual discussion and global economic policymaking.
In India, the current goal of financial inclusion is limited to providing everyone with the barest minimum of access to a savings bank account devoid of any extras. Globally, there is a far broader viewpoint on financial exclusion. Simply having a savings or current account is not a reliable measure of financial inclusion. Different levels of financial exclusion and inclusion may exist. At one extreme, it is feasible to pinpoint the super included, or clients who have access to various financial services and products and are actively and persistently courted by the financial services sector. The financially excluded among us could not access even the most basic services.
2. Review of literature
Several studies have found that the end of the social banking programme in 1990 had a detrimental influence on India's rural financial inclusion (Pal and Sapre, 2010; Inoue, 2011; Kumar, 2004; Burgess and Pande, 2005; Chakravarty and Pal, 2013; Burgess et al., 2005). Furthermore, the implementation of financial liberalisation in the Indian economy in the same year has led to the consistent growth in banking services in metropolitan areas (Inoue, 2011). The disparity between rural and urban areas in terms of financial inclusion has provided scholars an opportunity to examine the causes and effects of this uneven distribution of banking products and services in the period after liberalisation.
A number of studies have used different types of data sets and methodologies for the measurement and estimation of the level of financial inclusion in various areas. Several researchers (Sarma, 2008a, 2010b, 2012; Kuri and Laha, 2011; Laha and Kuri, 2014; Laha, 2015; Park and Mercado, 2016; Ambarkhane et al., 2014; Raichoudhury, 2016; Kim, 2016; Singh et al., 2014; Gupte et al., 2012; Kodan and Chhikara, 2013) have computed a multidimensional index of financial inclusion by taking into account various aspects of banking services, such as the extent of banking presence, availability of banking services, and utilisation of banking services. These studies generated the financial inclusion index using the same "distance-based approach" that the UNDP used to develop the Human Development Index. In this research, the financial inclusion index, which was created using the normalised inverse Euclidean distance technique, is compared to both cross-country and state-by-state analyses in India.
Furthermore, researchers have computed the financial inclusion index using other methods. Chakravarty and Pal (2013) employed the axiomatic method to assess financial inclusion in Indian states between 1972 and 2009. Previous research (Lenka and Sharma, 2017; Bagil and Dutta, 2012; Lenka and Bairwa, 2016) used the Principal Component Analysis (PCA) approach to estimate the financial inclusion index. The research also looked at the financial inclusion index developed using the Principal Component Analysis (PCA) method in connection to both SAARC nations and India's overall and state-level settings.
In contrast, the idea of financial inclusion has numerous dimensions. There are several measures that may be used to assess the level of financial inclusion. Researchers used several financial inclusion indicators depending on the availability and quality of data. Arora (2010) developed a financial access index (FAI) tailored to banks and non-banking financial institutions. The study examined three dimensions: outreach, transactional ease, and transactional cost. Kumar and Mishra (2009) attempted to analyse and appreciate financial inclusion by investigating both the supply and demand for financial services. They looked at many indices of banking outreach, including the number of deposit and credit accounts, bank branches, average deposit and credit amounts per account, and credit utilisation. They also looked at indices of household-level access, such as the proportion of households who have access to savings, credit, and insurance from both official and informal institutions. Bihari (2011) developed a financial inclusion index that takes into account many factors, including access to financial services, availability of such services, and usage of formal financial services.
The innovation of digital financial inclusion was hindered by several factors, including the restructuring of rural communities, the shift away from physical currency, political dynamics at the local and regional levels, and gender dynamics (Klyton et al., 2012). The discrepancy between rural and urban residents poses a challenge since the adoption of digital financial services remains low, and the majority of rural residents are not targeted by financial institutions for improved consumer outreach in digital financial inclusion efforts (Agwu, 2021).
Mehrotra et al. (2009) constructed a financial inclusion index for sixteen main states in India. They used in their study variables likely the number of rural offices, the number of rural deposit accounts, and the volume of rural deposits and credit in aggregate from banking data. In addition, the World Bank (2008) offers a comprehensive indicator of financial service accessibility, specifically the proportion of adults in 51 countries who possess an account with a financial intermediary. The World Bank's 2009 study "Banking the Poor" looked at the relationship between access to banking services, as measured by the number of bank accounts per thousand adults in each country, and a variety of factors such as the types of transactions offered by banks, the requirements imposed by banks, and the regulations implemented by country governments that may impact banking access. The study analysed data from 45 countries. Beck et al. (2009) examines the abundance of data on various facets of the financial system, but notes the absence of systematic measures for measuring the inclusivity of the financial sector. In a working paper for the Reserve Bank of India (RBI) titled “Financial Inclusion in India: A case-study of West Bengal (2011),” Sadhan Kumar Chattopadhyay investigated the level of financial inclusion in West Bengal. The study indicates a slight enhancement in outreach efforts within the banking industry, however the progress made is not substantial. Sarma (2008) created a financial inclusion Index by utilising collective banking indicators such as the number of accounts, bank branches, and the sum of deposit and credit as a percentage of its GDP for 55 nations.
In addition, Yadav and Sharma (2016) utilised the TOPSIS method to develop an index of financial inclusion (IFI) that incorporates many variables. They then used this index to rank the Indian states and Union territories. The confirmed elements that significantly impact financial inclusion are literacy rates, population density, infrastructure quality, farmer suicides, and the significance of agriculture to GDP. Multiple studies have consistently demonstrated that individuals have improved economic conditions when they are integrated into the financial system. Nevertheless, there are specific areas of research that have not been adequately addressed. There are only a limited number of studies that have methodically investigated the socio-economic development aspects that impact financial inclusion. Additional research is required to acquire a thorough understanding of IFI (inclusive financial institutions) and identify the socio-economic aspects that impact financial inclusion. When examined separately, several indicators fail to offer a comprehensive understanding of the actual situation (Camara & Tuesta, 2015; Chattopadhyay, 2011; Gupte et al., 2012), and various research appear to employ distinct approaches to assess financial inclusion. In addition, there is a lack of comprehensive measurement of financial inclusion due to the limited availability of data.
Financial Inclusion Index has been developed in the study by using the data on three dimensions of financial inclusion viz- Branch Dimension(D1), Business Correspondent Dimension(D2), and Credit Dimension(D3). The paper provides comparable insights between different states on the basis of Index of Financial Inclusion (IFI) rankings.
3. Data
sources and Methodology
Applying the CRISIL Inclusix Methodology for the year 2023, the study aims to measure the degree of financial inclusion in the rural-dominated states of India. A relative index called CRISIL Inclusix combines several types of fundamental financial services into one measurement. This is because determining the value alone can lead to incorrect findings since it can be disproportionately impacted by a small number of high-value transactions that may not accurately reflect the scope of financial inclusion. Instead, it is necessary to determine the extent to which financial services are available.
While developing the IFI, the study employs the methodology established by the CRISIL Inclusix Report, 2018. The study has taken three dimensions into consideration while creating the index of financial inclusion, likely branch dimension, business correspondent dimension and credit dimension. As the study has omitted the deposit dimension because most the people have the multiple deposit accounts associated with them that may mislead the result values of financial inclusion. The value of dimensions has been created by applying the following normalisation process.
![]() (1)
(1)
Where, Xi is the actual value of the particular dimension in the series. X(min) and X(max) are treated as the goal post values for the particular dimension. Dimensions are calculated on a scale of 0 to 100, where 100 is the maximum score achievable and 0 is the minimum score achievable. As the normalisation is done, the following dimensions are calculated respectively:
·
Branch
Dimension(D1): measures
the banking services' availability in a state's rural locations. The number of
banking units per lakh people is used to calculate it.
·
Business Correspondent (BC) Dimension (D2):
estimates the availability of business correspondents to provide rural
residents with doorstep banking services. The number of business correspondents
per lakh people is used to calculate it.
·
Credit Dimension(D3): Measures
the availability of lending facilities to rural populations. It is represented
by the number of loan accounts per lakh people.
Table 1
|
Table 1 Dimensions and Description of Financial Inclusion |
||
|
Dimension/Variable |
Description |
Data source |
|
Branch Dimension-banking
units |
Number of banking units in
the rural area per 100000 adult population |
RBI and SLBC |
|
Business correspondent (BC)
Dimension-Number of BCs |
Number of BCs in the rural
area per 100000 adult population |
SLBC |
|
Credit Dimension-Loan
accounts |
Number of loan accounts per
100000 adult population |
SLBC |
|
Source Compiled by Authors |
||
Now, by integrating these three dimensions-branch, business correspondents and credit in the three-dimensional cartesian space, such that 0 ≤D1, D2, D3≤ 100. Where, 0 is the no financial inclusion and 100 is the complete financial inclusion.
![]() (2)
(2)
D1, D2 and D3 are the branch, business correspondent and credit dimensions respectively. IFI is the final value of index. Index values of financial inclusion based on CRISIL Inclusix is divided in the following four categories.
Table 2
|
Table 2 Range of Index of Financial Inclusion |
|
|
IFI score |
Level of Financial Inclusion |
|
More than 55 |
High |
|
Ranges from 45.1 to 55 |
Above average |
|
Ranges from 35 to 45 |
Below average |
|
Below 35 |
low |
|
Source CRISIL Inclusix Report,
2018 |
|
4. Construction of dimensions of IFI
After following the above normalisation process, the major dimensions of index have been constructed for each of a state separately.
Table 3
|
Table 3 Indices of dimensions |
|||
|
Name of State |
Branch Dimension(D1) |
Business Correspondent(D2) |
Credit Dimension(D3) |
|
Himachal Pradesh |
100 |
0 |
100 |
|
Bihar |
0 |
49.98 |
44.32 |
|
Assam |
8.19 |
100 |
37.33 |
|
Odisha |
24.62 |
92.60 |
98.81 |
|
Meghalaya |
27.05 |
16.84 |
11.70 |
|
Uttar Pradesh |
9.69 |
89.63 |
14.81 |
|
Arunachal Pradesh |
35.65 |
68.15 |
10.84 |
|
Chhattisgarh |
25.72 |
58 |
0 |
|
Jharkhand |
8.8 |
26.21 |
58.26 |
|
Rajasthan |
17.64 |
93.62 |
27.99 |
|
Source Author’s calculation |
|||
Figure 1
|
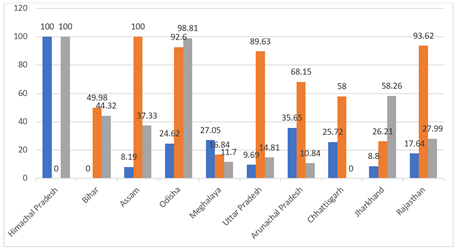
Figure 1 Comparison of Financial Inclusion Scores |
Table 3 depicts the dimensional values attained by selected states in terms of branch dimension(D1), business correspondent(D2) and credit dimension(D3) respectively. In the branch and credit dimension, Himachal Pradesh attained highest score of (100, 100) and lowest score of 0 in business correspondent dimension among the selected states. The highest scores may be associated with the surfeit of bank branches as compared to states like Bihar, Assam and Uttar Pradesh because it has small land area and low population in comparison to these states. The lowest value of business correspondent dimension may be associated with the highest concentration of bank branches in Himachal Pradesh as authorities did not find it necessary to open more BCs in these areas, because mostly the business correspondents are to be established in those areas where branch concentration is found low. Bihar has attained lowest score of 0 in branch dimension as it was expected. This may be associated with the several reasons like low literacy, poverty and unemployment because these are the barriers of financial inclusion. Chhattisgarh attained lowest score of 0 in credit dimension. This is mainly because of the fact that it inherited a very low level of physical as well as social infrastructure at the time of its formation in the year 2000 and cultural factors and policy environment.
5. Index of Financial Inclusion (IFI)
To construct the final index of financial inclusion, the study combined the three key aspects listed above into a single formula (2). As a result, the financial inclusion index for each selected state has been developed separately.
Table 4
|
Table 4 Financial Inclusion Rank of Selected States |
||
|
Rank |
||
|
Himachal Pradesh |
94.2 |
1 |
|
Bihar |
55.59 |
2 |
|
Odisha |
55.45 |
3 |
|
Rajasthan |
35.55 |
4 |
|
Assam |
34.62 |
5 |
|
Arunachal Pradesh |
32.8 |
6 |
|
Jharkhand |
26.76 |
7 |
|
Uttar Pradesh |
26.72 |
8 |
|
Chhattisgarh |
22.68 |
9 |
|
Meghalaya |
16.84 |
10 |
|
Source Author’s Calculation |
||
|
|
||
Figure 2
|
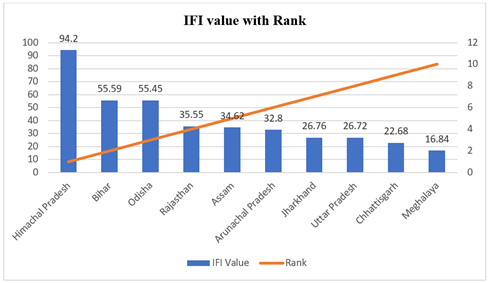
Figure 2 IFI Value
with Rank |
6. Final Results and Discussions
Table 4 depicts the financial inclusion
scores obtained by the chosen states after applying the CRISIL methodology.
Himachal Pradesh obtained the maximum score of 94.2 and was put in the high
category, while Meghalaya received the lowest score of 16.84 and was placed in
the low category. It is evident from the dimensional indices that Himachal
Pradesh has scored highest score in two of the dimensions as compared to the
other selected states and the reasons are already given in the section 4
respectively. Same is the case with Meghalaya which has secured lowest rank
among the selected states due to the lowest values achieved in the two
dimensions. The rest of the states, like as Bihar and Odisha, scored 55.59 and
55.45, respectively, placing them above average. Assam scored 34.62, placing it
in the below-average category. The remaining selected states, Arunachal
Pradesh, Jharkhand, Uttar Pradesh, and Chhattisgarh, obtained scores of 32.8,
26.76, 26.72, and 22.68, respectively, placing them in the low category.
7. Conclusion and Policy Implications
Financial
inclusion was computed for 10 Indian rural dominated states of three dimensions
namely, branch and credit dimension and BCs on the basis of the availability of
data. Measuring financial inclusion is vital for understanding the level to
which individuals and businesses have access to and use financial services.
Drawing conclusions from such measurements can have significant policy
implications:
1)
Identifying
Gaps: Measurement helps
identify demographic groups, regions, or sectors that are excluded or
underserved by traditional financial services. This insight is essential for
policymakers to target interventions effectively.
2)
Assessing
Progress: Regular
measurement allows for tracking progress over time. It helps gauge the
effectiveness of policies and initiatives aimed at promoting financial
inclusion, highlighting areas of success and areas needing improvement.
3)
Informing
Policy Design: The data
collected can inform the design of policies and programs aimed at enhancing
financial inclusion. For instance, if certain communities lack access to
banking services, policymakers might consider establishing mobile banking or
agent banking networks to reach them.
4)
Stimulating
Innovation: Understanding
the specific needs and behaviours of underserved populations can stimulate
innovation in financial products and services. Financial institutions and
fintech companies may develop tailored solutions to reach these segments more
effectively.
5)
Promoting
Economic Growth: Improved
financial inclusion may boost economic growth by allowing people as well as
businesses to borrow, save, invest, and engage more fully in the economy. Policymakers
can use measurements to prioritize initiatives that support inclusive economic
development.
6)
Enhancing
Social Welfare: Financial
inclusion is often associated with improved social welfare outcomes, such as
poverty reduction, increased resilience to economic shocks, and greater
empowerment, especially for women and marginalized groups. Policies aimed at
enhancing inclusion can thus contribute to broader social objectives.
7)
Addressing
Regulatory Challenges:
Measurement can highlight regulatory barriers that hinder financial inclusion,
such as overly restrictive banking regulations or cumbersome identification
requirements. Policymakers can use this information to streamline regulations
while ensuring consumer protection and financial stability.
In conclusion, measuring financial inclusion provides valuable insights that can guide policymaking efforts to promote inclusive and sustainable economic development. By identifying gaps, assessing progress, informing policy design, stimulating innovation, promoting economic growth, enhancing social welfare, and addressing regulatory challenges, policymakers can work towards creating a more inclusive financial system that benefits all members of society.
CONFLICT OF INTERESTS
None.
ACKNOWLEDGMENTS
None.
REFERENCES
|
|
 This work is licensed under a: Creative Commons Attribution 4.0 International License
© ShodhKosh 2024. All Rights Reserved.